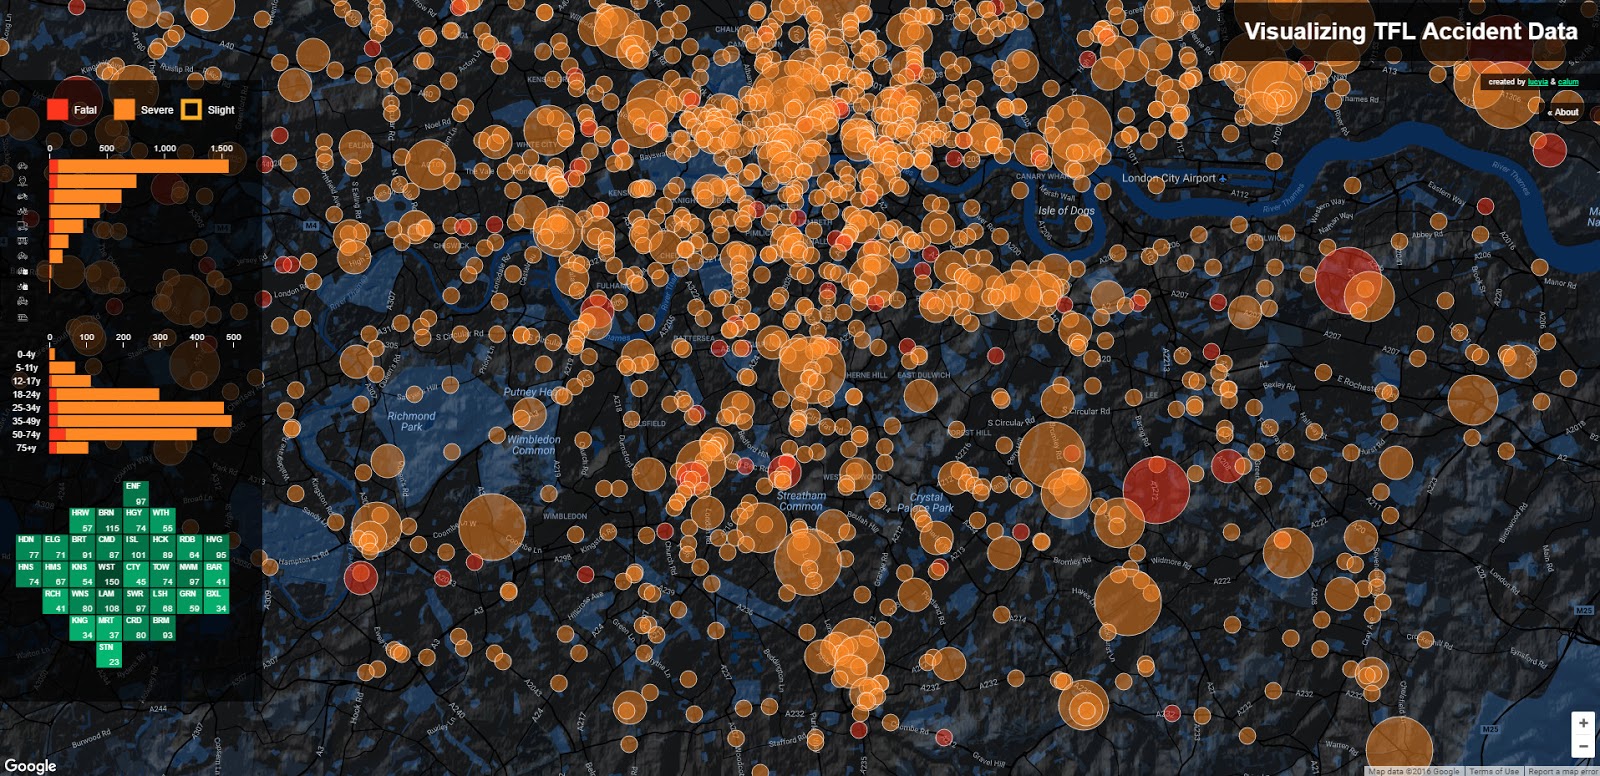
Visualizing transport for London accidents data
This interactive visualisation aims to display traffic accident information as kept by Transport for London for the year 2015. The traffic incidents are plotted geographically on the map, colour coded by severity, and there are some interactive summary statistics in the left panel.
Related post:
– London’s Tube Heartbeat

