Happiness can be a subjective and complex topic that depends on various factors. However, several studies and surveys have attempted to measure and identify the happiest places in the United States. These studies often consider factors like economic stability, job satisfaction, social support, work-life balance, access to healthcare, and overall quality of life.
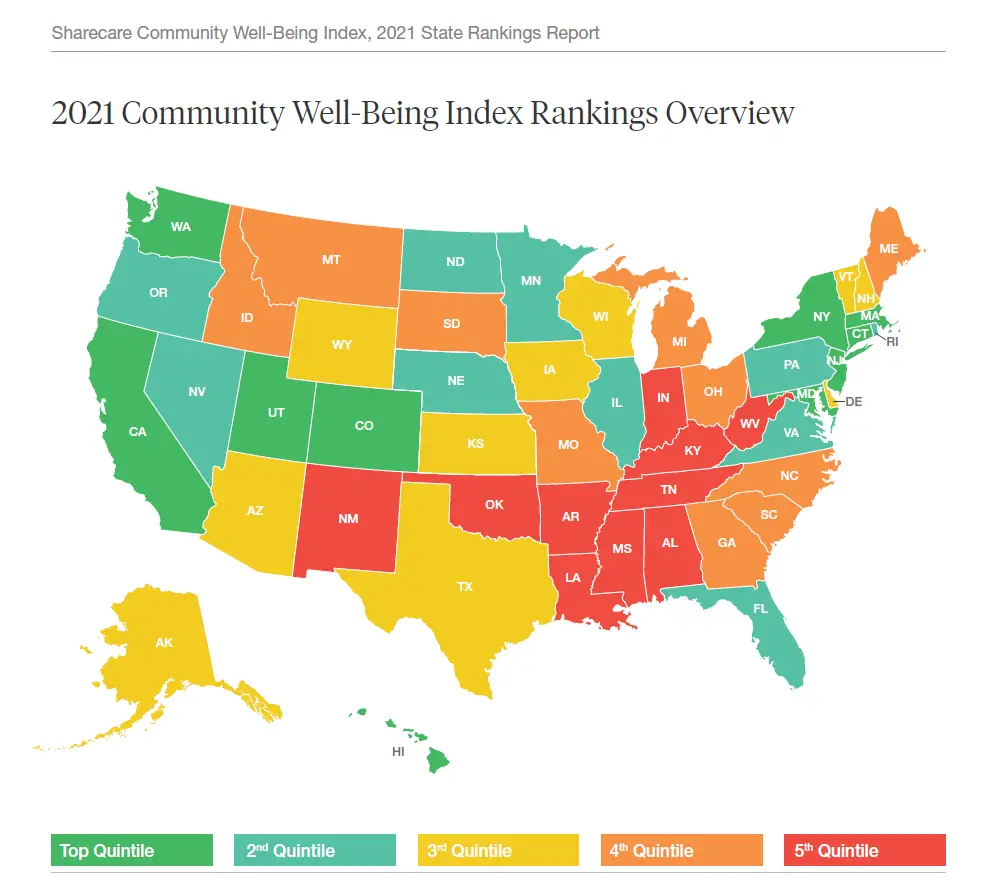
One well-known survey that examines happiness in the United States is the Gallup-Sharecare Well-Being Index, which measures well-being across various states and cities. According to this index, as of 2021, states like Hawaii, Colorado, and Utah often ranked among the highest in terms of happiness and well-being.
Hawaii, in particular, consistently ranked as one of the happiest states in the U.S., largely due to its beautiful natural surroundings, favorable climate, and strong sense of community. Other factors, like a healthy lifestyle, strong social connections, and a strong economy, also contribute to the overall happiness of residents in these states.
Keep in mind that happiness can vary depending on personal preferences, lifestyle, and individual circumstances. Additionally, rankings and happiness factors may have changed since my last update. For the most up-to-date information, I recommend referring to more recent studies and reports on happiness in the United States.
The map below shows the happiest states in the U.S. according to Gallup Health and Well-Being Index 2021.
Data are based on more than 500 thousand surveys with U.S. adults.
The Well-Being Index is calculated on a scale of 0 to 100, where 0 represents the lowest possible wellbeing and 100 represents the highest possible wellbeing. The Well-Being Index including 5 essential elements of wellbeing: Career, Social, Financial, Community, and Physical.
To learn more about the happiness, have a look at the following books:
Probably not an accident that Utah also has some of the highest rates of prescription for behavior modification drugs.
Alex
7 years ago
I don’t think most Americans have any idea what “happiness” is,, and confuse the term with what could more accurately be called a transient contentment.
Chaplin
7 years ago
I’m originally from Rhode Island, never knew anyone there that was “happy” there.
")

")


")

Probably not an accident that Utah also has some of the highest rates of prescription for behavior modification drugs.
I don’t think most Americans have any idea what “happiness” is,, and confuse the term with what could more accurately be called a transient contentment.
I’m originally from Rhode Island, never knew anyone there that was “happy” there.