When you look at a world map, you might see vast blue expanses representing our planet’s oceans. But did you know that these waters aren’t uniformly salty? Ocean salinity – the concentration of dissolved salts in seawater – varies across the globe, creating a fascinating pattern that tells us much about our planet’s water cycle and climate.
Salinity is measured in parts per thousand (ppt), representing the grams of dissolved salts per kilogram of seawater. The average ocean salinity is about 35 ppt, but this number fluctuates depending on location and various factors.
A World Map of Ocean Salinity
To truly grasp the global distribution of ocean salinity, we need to look at a specialized world map. One excellent example is the world map of ocean salinity created by Perrin Remonté. This detailed map showcases the varying levels of salinity across our planet’s oceans, revealing intriguing patterns and hotspots.
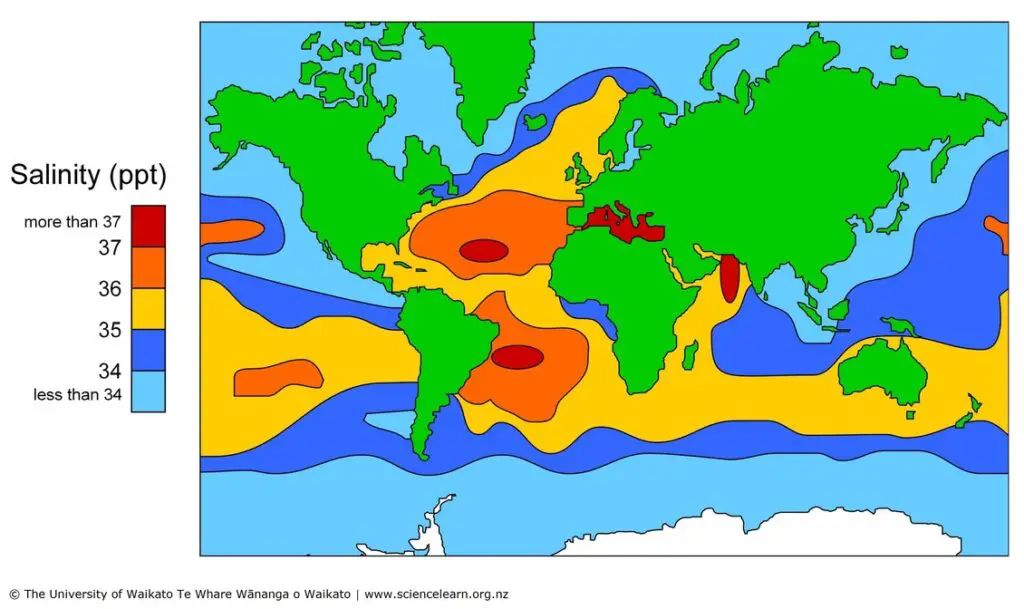
Another useful resource is the simplified schematic map of world ocean salinity produced by the University of Waikato Te Whare Wānanga o Waikato. This map provides a clear overview of general salinity trends, making it easier to identify broad patterns at a glance.
The Saltiest Seas: A Global Ranking
While it’s challenging to create a definitive ranking due to seasonal variations and changing conditions, some bodies of water consistently rank among the saltiest. Here’s a general list of some of the world’s saltiest seas:
Rank
Sea / Water body
Salinity
1
Don Juan Pond, Antarctica
~440 ppt
2
Dead Sea
~340 ppt
3
Great Salt Lake, Utah
~160 ppt
4
Red Sea
~40 ppt
5
Mediterranean Sea
~38 ppt
6
Persian Gulf
~37-38 ppt
It’s important to note that these are average values, and salinity can vary within these water bodies.
Salinity Through the Ages
Ocean salinity hasn’t remained constant throughout Earth’s history. During different geological epochs, factors such as climate change, tectonic activity, and changes in the water cycle have influenced ocean salinity.
For instance, during the last ice age (about 20,000 years ago), ocean salinity was generally higher. This was because more freshwater was locked up in ice sheets, concentrating the remaining seawater.
Conversely, during warmer periods in Earth’s history, such as the Cretaceous period (145-66 million years ago), ocean salinity might have been lower due to increased rainfall and a more vigorous water cycle.
Understanding these historical changes helps scientists predict how ocean salinity might shift in response to current and future climate change.
Final Thoughts
The next time you look at a world map, remember that the uniform blue of the oceans hides a complex mosaic of varying salinity. This invisible characteristic of our oceans plays a crucial role in global climate patterns, marine ecosystems, and the Earth’s water cycle. By studying ocean salinity, we gain valuable insights into our planet’s past, present, and future.
For those interested in diving deeper into this fascinating topic, consider exploring these resources:
The World Ocean Atlas – A comprehensive collection of oceanographic data, including detailed salinity information.
Ocean: A Photicular Book – While not specifically about salinity, this book offers a stunning visual journey through marine environments.
World Ocean Database – For those who love raw data, this compilation includes extensive salinity measurements from around the globe.


")
?")


