The worst drivers in the United Kingdom
The geography of driving offenses across the United Kingdom reveals interesting patterns about road safety and driver behavior. Let’s examine which areas have the highest rates of traffic violations and what this tells us about road safety across the country.
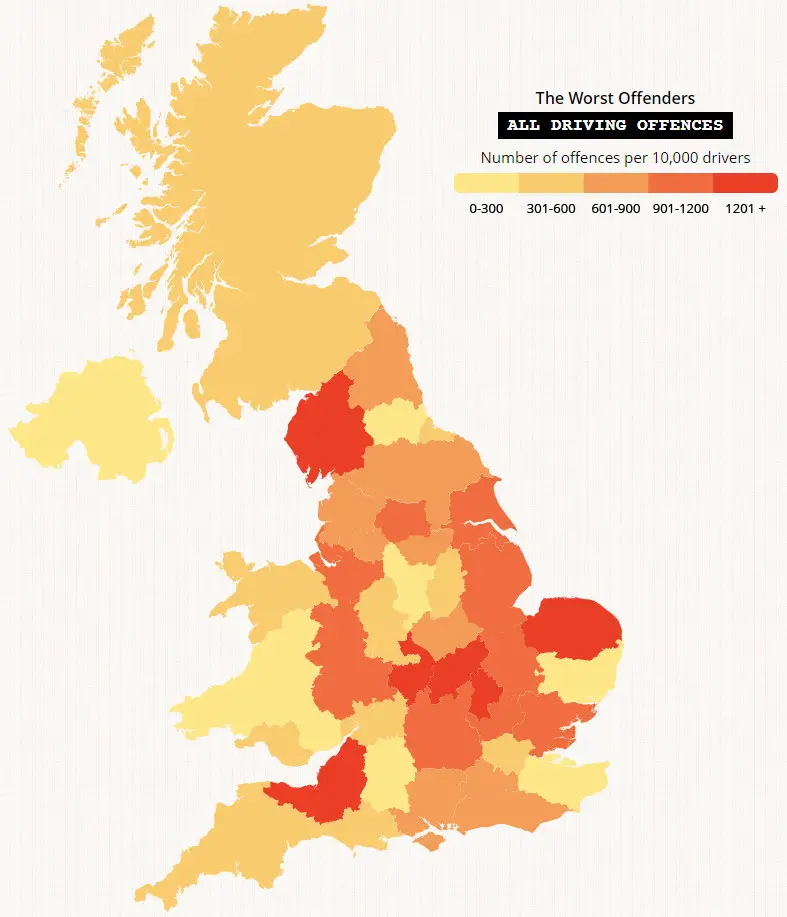
This map visualizes the current distribution of driving offenses across UK regions. The varying shades tell a compelling story about regional differences in driving behavior and enforcement.
Historical Picture: 2018 Police Force Data
In 2018, an analysis of Fixed Penalty Notices showed significant variations across police force areas:
Top 10 Areas for Driving Offenses in 2018 (per 10,000 drivers)
| Police Force Area | Offenses per 10,000 drivers |
| Avon and Somerset | 1,785 |
| Cumbria | 1,455 |
| Warwickshire | 1,410 |
| Norfolk | 1,388 |
| Bedfordshire | 1,385 |
| Northamptonshire | 1,231 |
| Humberside | 1,148 |
| Lincolnshire | 1,124 |
| West Yorkshire | 1,120 |
| Merseyside | 1,107 |
These statistics combined data from official government sources across England & Wales, Scotland, and Northern Ireland, along with DVLA records of active driving licenses. Notably, both rural areas like Cumbria and more urban regions like West Yorkshire appeared in the top rankings, suggesting that high offense rates weren’t limited to any particular type of region.
Current Landscape: 2024 Regional Analysis
Recent DVLA data shows how the situation has evolved:
Drivers with Penalty Points by Region (2024)
| Region | Number of Drivers |
| South East | 205,678 |
| Greater London | 180,205 |
| North West | 155,236 |
| South West | 149,568 |
| Yorkshire and the Humber | 143,888 |
| East England | 134,311 |
| West Midlands | 126,264 |
| East Midlands | 122,338 |
| North East | 39,392 |
The 2024 data reveals that speeding remains the most common offense, with 941,495 cases of breaking the speed limit on public roads and 231,669 cases on motorways. Other significant issues include driving without insurance and mobile phone use while driving.
Understanding Regional Patterns
Several factors contribute to these regional variations in driving offenses:
Urban vs Rural Dynamics
Dense urban areas like Greater London show high absolute numbers of offenses, likely due to higher traffic volumes and more complex road networks. However, some rural areas also show surprisingly high offense rates, suggesting different challenges in these regions.
Traffic Volume and Road Types
The South East’s high numbers reflect its busy road network and large commuter population. Similarly, the North West’s significant figures might be influenced by its mix of major cities and extensive motorway network.
Enforcement Patterns
Different regions may have varying levels of traffic enforcement and different types of monitoring technology, from speed cameras to mobile phone detection systems.
Major Safety Concerns
The current data highlights several key road safety issues:
Speeding
The overwhelming number of speed-related offenses (over 1.1 million combined on public roads and motorways) indicates this remains a persistent safety challenge. David Kottaun from Scrap Car Comparison warns: “Even just a few miles per hour above the speed limit can have devastating consequences in the event of a collision and make all the difference to stopping distances in inclement weather”.
Vehicle Maintenance
The presence of maintenance-related violations, such as defective tires, points to concerning gaps in basic vehicle upkeep. As Kottaun notes, “There really aren’t any excuses for this one and the result could be much worse than the cost of a replacement tyre.”
Insurance Compliance
The high number of uninsured driving cases presents risks not only to the offending drivers but to all road users, potentially affecting insurance costs across regions.
Impact on Road Safety
These statistics help identify where additional road safety measures might be needed. They highlight the need for:
- Targeted enforcement in high-offense areas
- Better driver education about vehicle maintenance
- Enhanced monitoring of uninsured vehicles
- Improved understanding of why certain regions show higher offense rates
Have you noticed different driving behaviors in various parts of the UK? What do you think causes some regions to have higher offense rates than others? Share your experiences in the comments below.


")

