I’ve produced many maps of the 2024 election — some at state level, others at county detail — and a few that treated the results as an artificial landscape (the “Trump archipelago,” or Mars-/Moon-like views). What those maps didn’t show was how men and women, and people with and without a college degree, voted. Reddit user crazyboyhere made four maps that split the electorate by education (college / non-college) and gender (women / men).
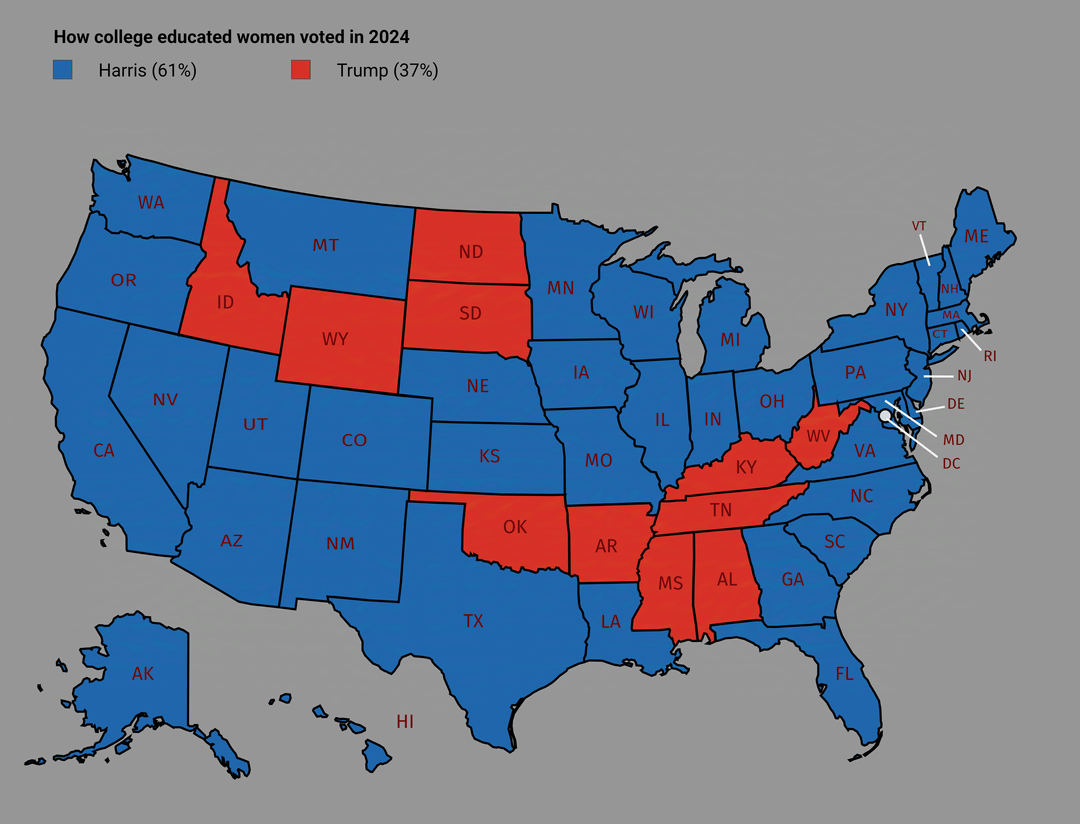
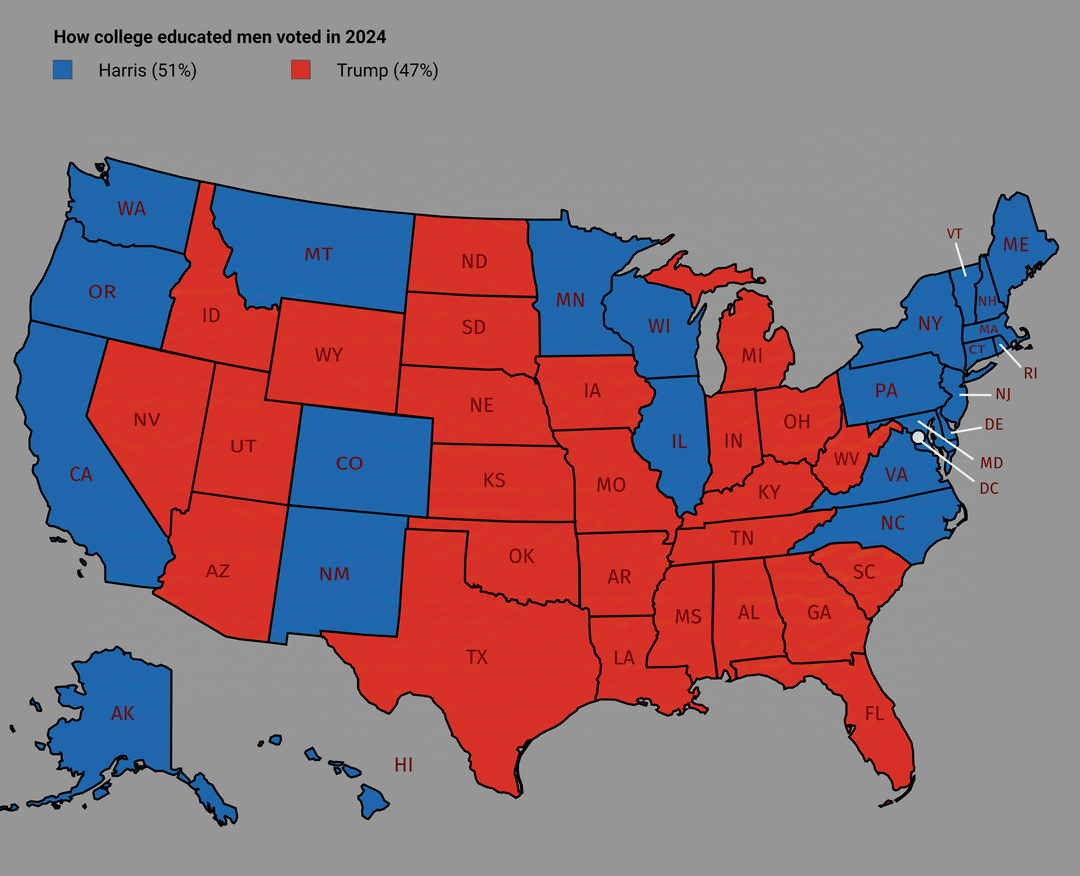
College-educated women vs. college-educated men
61% of college-educated women nationwide voted for Harris, 37% for Trump51% of college-educated men nationwide voted for Harris, 47% for Trump
College-educated women show a steady Democratic preference in most metropolitan corridors and denser suburban belts; their support stretches across large urban regions and many university centers. There are, however, pockets of opposite preference in lower-density and resource-oriented parts of the interior — narrow clusters where local economies and social conservatism pull college-educated women the other way. College-educated men look more mixed: the same coastal metros and big regional cities still lean Democratic, but the margin is thinner in many suburban and smaller-metro rings. In practical terms, the maps show that education pulls voters in one direction while local social and economic context — and gender — tune how strongly that pull is expressed.
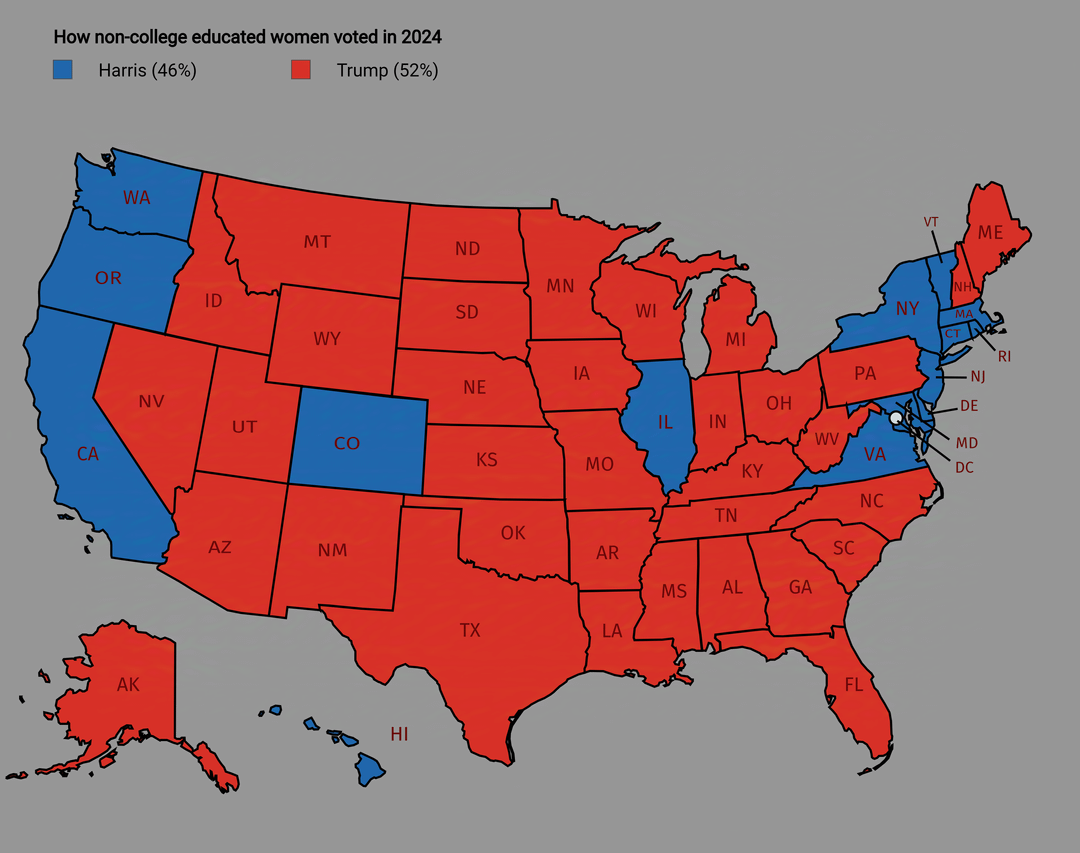
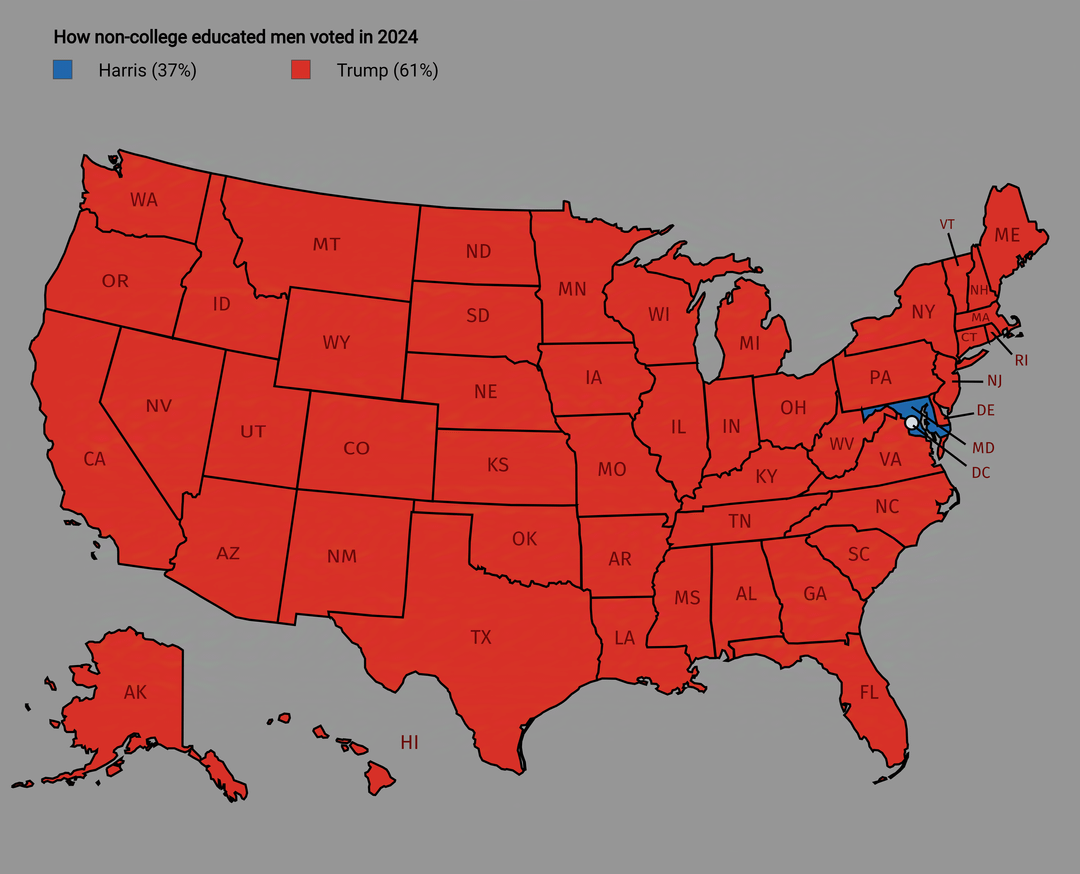
Non-college women vs. non-college men
46% of non-college women nationwide voted for Harris, 52% for Trump37% of non-college men nationwide voted for Harris, 61% for Trump
Among voters without a four-year degree, the maps change in intensity. Non-college women still show Democratic majorities around dense urban areas and some industrial metro zones; away from those pockets, they tend to lean Republican. Non-college men, by contrast, provide the deepest Republican concentrations: large contiguous swaths of lower-density territory are strongly Republican for this group, and only a few dense, government- or institution-centered places remain Democratic.