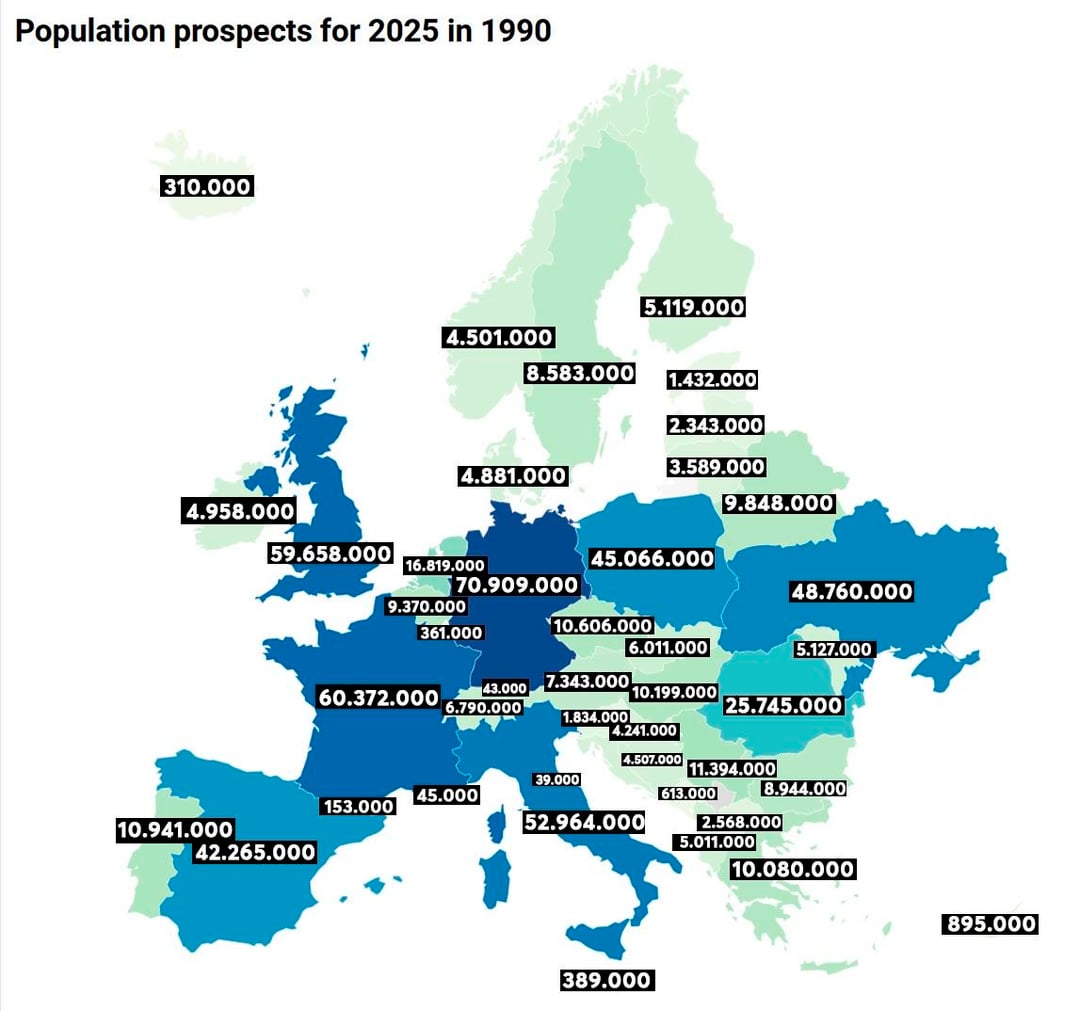
When Demographers Tried to Predict 2025… Back in 1990
Europe’s population kept going up through most of the 1900s. More people every decade. Cities getting bigger, suburbs spreading further out. By 1990, this trend had lasted so long that UN demographers probably believed it would continue when they made their predictions for 2025.
They made their forecasts using what’s called medium variant projections. Some countries didn’t even exist yet when they made these – USSR was still around, Yugoslavia hadn’t split up – so those got added later with 1994 data once the new countries actually existed.
35 years later, here we are in 2025. How’d they do?
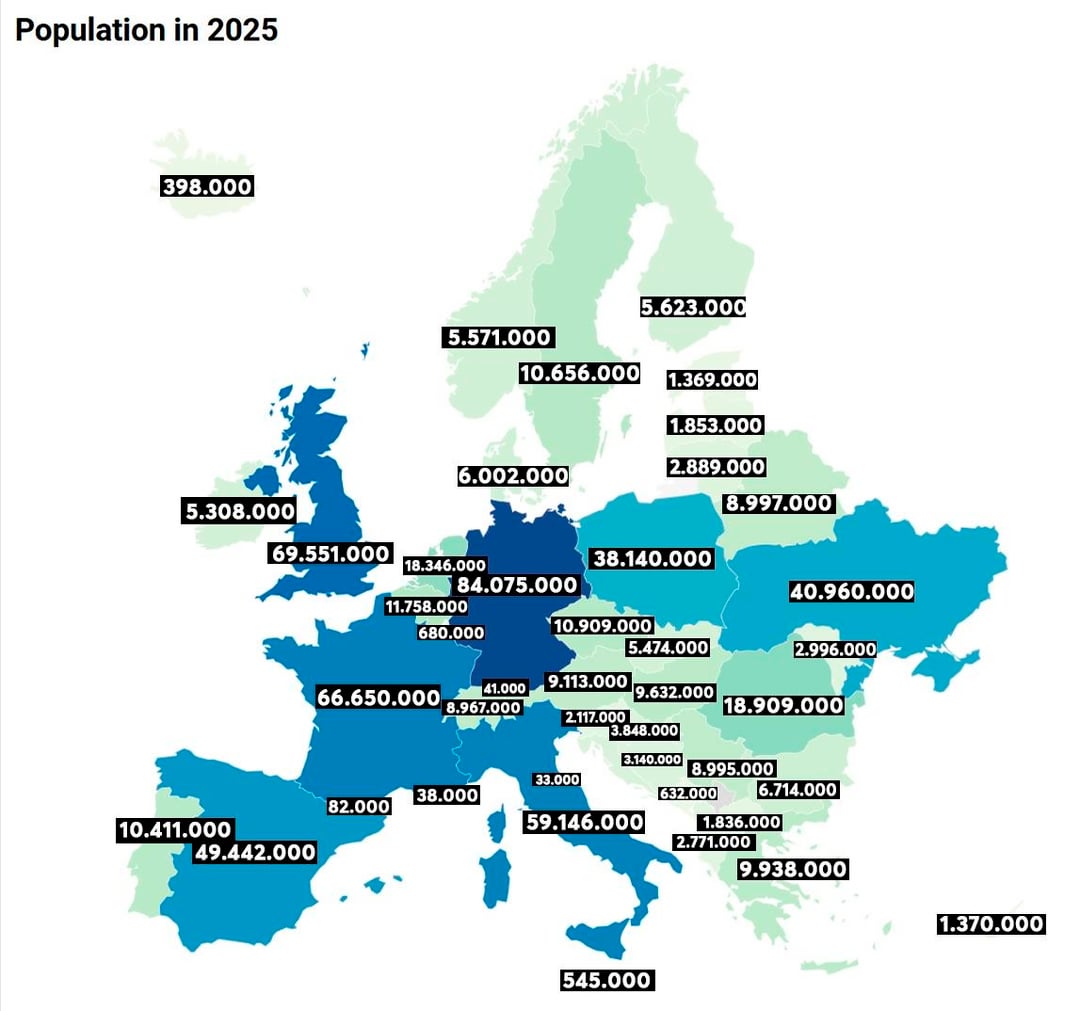
Western Europe went over most predictions. Eastern Europe came up way short. Luxembourg almost doubled. Andorra lost nearly half.
| Country | 1990 Population | 1990 Projection for 2025 | 2025 Actual | Difference | % Change |
|---|---|---|---|---|---|
| Iceland | 255,000 | 310,000 | 398,000 | +88,000 | +28.4% |
| Norway | 4,241,000 | 4,501,000 | 5,571,000 | +1,070,000 | +23.8% |
| Sweden | 8,559,000 | 5,119,000 | 5,623,000 | +504,000 | +9.8% |
| Finland | 4,986,000 | 8,583,000 | 10,656,000 | +2,073,000 | +24.2% |
| Denmark | 5,141,000 | 4,881,000 | 6,002,000 | +1,121,000 | +23.0% |
| Estonia | 1,565,000 | 1,432,000 | 1,369,000 | -63,000 | -4.4% |
| Latvia | 2,668,000 | 2,343,000 | 1,853,000 | -490,000 | -20.9% |
| Lithuania | 3,698,000 | 3,589,000 | 2,889,000 | -700,000 | -19.5% |
| Poland | 38,119,000 | 45,066,000 | 38,140,000 | -6,926,000 | -15.4% |
| Germany | 79,753,000 | 70,909,000 | 84,075,000 | +13,166,000 | +18.6% |
| Netherlands | 14,952,000 | 16,819,000 | 18,346,000 | +1,527,000 | +9.1% |
| Belgium | 9,967,000 | 9,370,000 | 11,758,000 | +2,388,000 | +25.5% |
| Luxembourg | 382,000 | 361,000 | 680,000 | +319,000 | +88.4% |
| France | 56,735,000 | 60,372,000 | 66,650,000 | +6,278,000 | +10.4% |
| United Kingdom | 57,237,000 | 59,658,000 | 69,551,000 | +9,893,000 | +16.6% |
| Ireland | 3,503,000 | 4,958,000 | 5,308,000 | +350,000 | +7.1% |
| Portugal | 9,899,000 | 10,941,000 | 10,411,000 | -530,000 | -4.8% |
| Spain | 38,851,000 | 42,265,000 | 49,442,000 | +7,177,000 | +17.0% |
| Andorra | 54,000 | 153,000 | 82,000 | -71,000 | -46.4% |
| Monaco | 30,000 | 45,000 | 38,000 | -7,000 | -15.6% |
| Switzerland | 6,674,000 | 6,790,000 | 8,967,000 | +2,177,000 | +32.1% |
| Liechtenstein | 29,000 | 43,000 | 41,000 | -2,000 | -4.7% |
| Austria | 7,729,000 | 7,343,000 | 9,113,000 | +1,770,000 | +24.1% |
| Czechia | 10,362,000 | 10,606,000 | 10,909,000 | +303,000 | +2.9% |
| Slovakia | 5,298,000 | 6,011,000 | 5,474,000 | -537,000 | -8.9% |
| Hungary | 10,375,000 | 10,199,000 | 9,632,000 | -567,000 | -5.6% |
| Romania | 23,207,000 | 25,745,000 | 18,909,000 | -6,836,000 | -26.6% |
| Moldova | 4,364,000 | 5,127,000 | 2,996,000 | -2,131,000 | -41.6% |
| Ukraine | 51,556,000 | 48,760,000 | 40,960,000 | -7,800,000 | -16.0% |
| Belarus | 10,189,000 | 9,848,000 | 8,997,000 | -851,000 | -8.6% |
| Italy | 56,719,000 | 52,964,000 | 59,146,000 | +6,182,000 | +11.7% |
| San Marino | 23,000 | 39,000 | 33,000 | -6,000 | -15.4% |
| Slovenia | 1,998,000 | 1,834,000 | 2,117,000 | +283,000 | +15.4% |
| Croatia | 4,784,000 | 4,241,000 | 3,848,000 | -393,000 | -9.3% |
| Bosnia and Herzegovina | 4,308,000 | 4,507,000 | 3,140,000 | -1,367,000 | -30.3% |
| Serbia | 9,779,000 | 8,944,000 | 6,714,000 | -2,230,000 | -24.9% |
| Montenegro | 615,000 | 513,000 | 632,000 | +119,000 | +23.2% |
| North Macedonia | 1,909,000 | 2,568,000 | 1,836,000 | -732,000 | -28.5% |
| Albania | 3,289,000 | 5,001,000 | 2,771,000 | -2,230,000 | -44.6% |
| Greece | 10,160,000 | 10,080,000 | 9,938,000 | -142,000 | -1.4% |
| Bulgaria | 8,718,000 | 8,944,000 | 6,714,000 | -2,230,000 | -24.9% |
| Cyprus | 681,000 | 895,000 | 1,370,000 | +475,000 | +53.1% |
| Malta | 359,000 | 389,000 | 545,000 | +156,000 | +40.1% |
Luxembourg Went All-In on Banking
Luxembourg had 382,000 people in 1990. The UN said they’d have 361,000 by now. They’ve actually got 680,000. That’s 88% higher than predicted.
Steel was Luxembourg’s thing back in 1990. Then over the next decade or so, the whole country shifted into banking and finance. It became one of Europe’s major financial centers. GDP per capita went higher than anywhere else. If you worked in Brussels and could get a job in Luxembourg, you’d make maybe 30-40% more. People moved there from all over Europe.
The people making forecasts in 1990 were looking at a steel economy. They couldn’t have known it would transform this much.
Greece Got There But Not How They Expected
They predicted Greece would have 10,080,000 people. It’s got 9,938,000 now. That’s only 142,000 off, which is about 1.4%. Best prediction in the whole dataset.
But it didn’t happen the way the model expected at all. They figured the population would keep growing as the economy got better and Greece got more tied into the EU. For a while it did go that way. Tourism was booming, there was construction all over, EU money coming in, the numbers climbing pretty much on schedule.
Then the 2009 crisis hit and it really hurt the country. Youth unemployment went over 50 percent and a lot of young Greeks left for Germany, the UK, Australia, wherever they could find jobs. Birth rates fell sharply. The population dropped again until it landed almost exactly where the old forecast said it would.
Andorra’s Mountain Problem
They thought Andorra would have 153,000 people. It’s got 82,000. Almost half what they predicted.
Andorra did fine economically. It became a tax haven, businesses came in from Spain and France, money flowed. But Andorra’s in a valley with mountains all around it. You can’t just make more valley. Housing got crazy expensive. Young people who grew up there couldn’t afford it anymore and moved to cheaper Spanish and French towns just across the borders.
Now there’s a waiting list to move to Andorra. Application fee is €50,000 and it’s non-refundable. Want to live there without working? You need to invest €1,000,000 in the country. When you run out of space, economic success doesn’t fix it.
Where Eastern Europeans Went
Eastern Europe is where the forecasts went wrong the most. Poland had 38 million people in 1990 and they thought it would reach 45 million but it’s stayed right around 38 million the whole time. Romania started at 23 million, was supposed to get to 25.7 million, and instead fell to 18.9 million. Moldova was 41.6 percent below the forecast, Albania 44.6 percent. Bulgaria, Latvia, Lithuania — the same thing happened there, all of them millions short.
Roughly 25 million people left Eastern Europe for the west between 1990 and 2015. That’s more than Romania has now. The countries with less stable governments and fewer good opportunities lost the most of their younger and educated people who went looking for better pay in Germany, France and the UK. All those people helped push the western numbers higher in ways the 1990 models never included.
Why They Got It Wrong
A lot of this was hard to see coming at the time. The forecasts came out in 1990 just after the Berlin Wall fell and while Germany was reunifying. The Soviet Union held on until the end of 1991.
EU expansion creating freedom of movement between countries with huge wage gaps? Couldn’t see it yet. Wars tearing through Yugoslavia in the 90s? Not predictable from 1990. Luxembourg going from steel to banking? Not obvious. Ireland’s economic boom? Not on the radar.
Birth rates dropped faster than expected, especially in Southern and Eastern Europe. Migration completely reshaped where people actually live.
What’s Predicted for 2050
Eurostat’s 2025 projections have the EU at about 450 million now. They expect it to peak around 453 million near 2026 and then ease back to roughly 448 million by 2050.
The headline number makes it look fairly stable but the differences between countries are big. The European Commission worked out that without any migration the EU would lose about 14 percent of its population by 2050. Migration helps reduce that loss but it doesn’t get rid of it.
Luxembourg, Ireland, Sweden, the Netherlands, France are projected to keep growing. Bulgaria, Lithuania, Latvia keep shrinking – they’ve already lost over 20% from their peaks.
EU fertility averages 1.5 births per woman. You need 2.1 just to maintain population. Even with about a million migrants per year coming in, population still declines because there aren’t enough young people. Demographers call this “negative population momentum.”
Bruegel’s 2024 research shows that between 2023 and 2050, natural population change will average negative 3 per thousand annually. Migration adds 2.6 per thousand. That’s still a net decline.
These 2050 forecasts could easily be as far off as the 1990 ones were. Migration is really hard to predict. Political changes, economic problems, conflicts, climate effects — any of them could cause movements we aren’t expecting. Fertility might go up if policies actually help families or it could drop more if things get harder. Remote work could also change where people want to live.


