Mapping Religious Identity Across the UK
The United Kingdom is characterized by religious diversity. The 2021 Census numbers show a major change. Christians fell below half the population for the first time, now at 46.5%. Non-religious people? 37.8%. Muslims represent 6% of the UK. Hindus are 1.6% of the population, Sikhs 0.8%. Jews and Buddhists are both around 0.4%.

Those numbers don’t mean much until you look at where people actually live. Northern Ireland is nearly 80% Christian. Meanwhile in Scotland, over half the population says they have no religion. London has a large Muslim population at 15%. Travel to Northern Ireland and Muslims make up less than 1%.
Christian Populations Across Regions
Northern Ireland stands at 79.7% Christian. The sectarian conflicts there left lasting marks on how people identify religiously. England’s North East comes next at 50.8%. That’s the only other region breaking 50%.
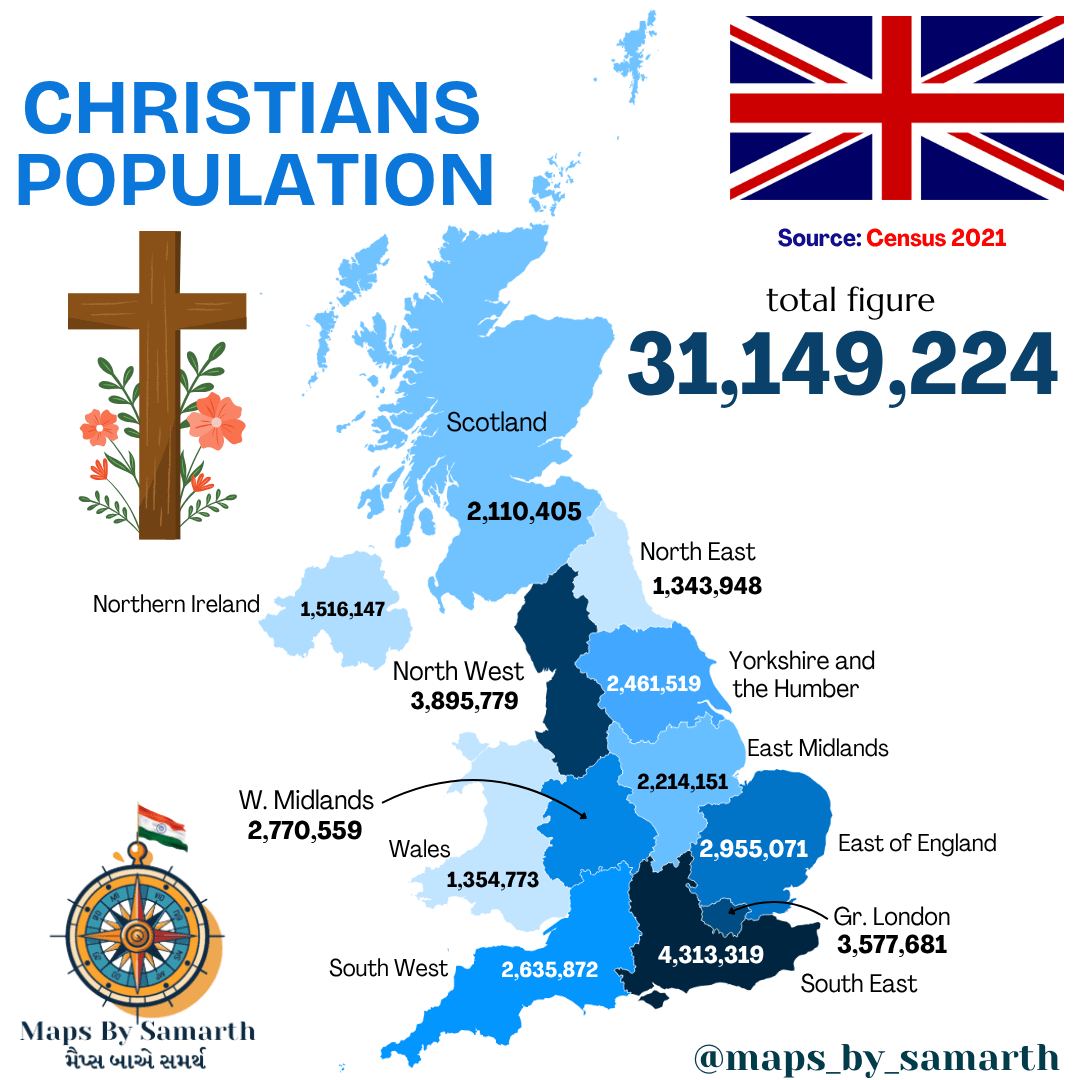
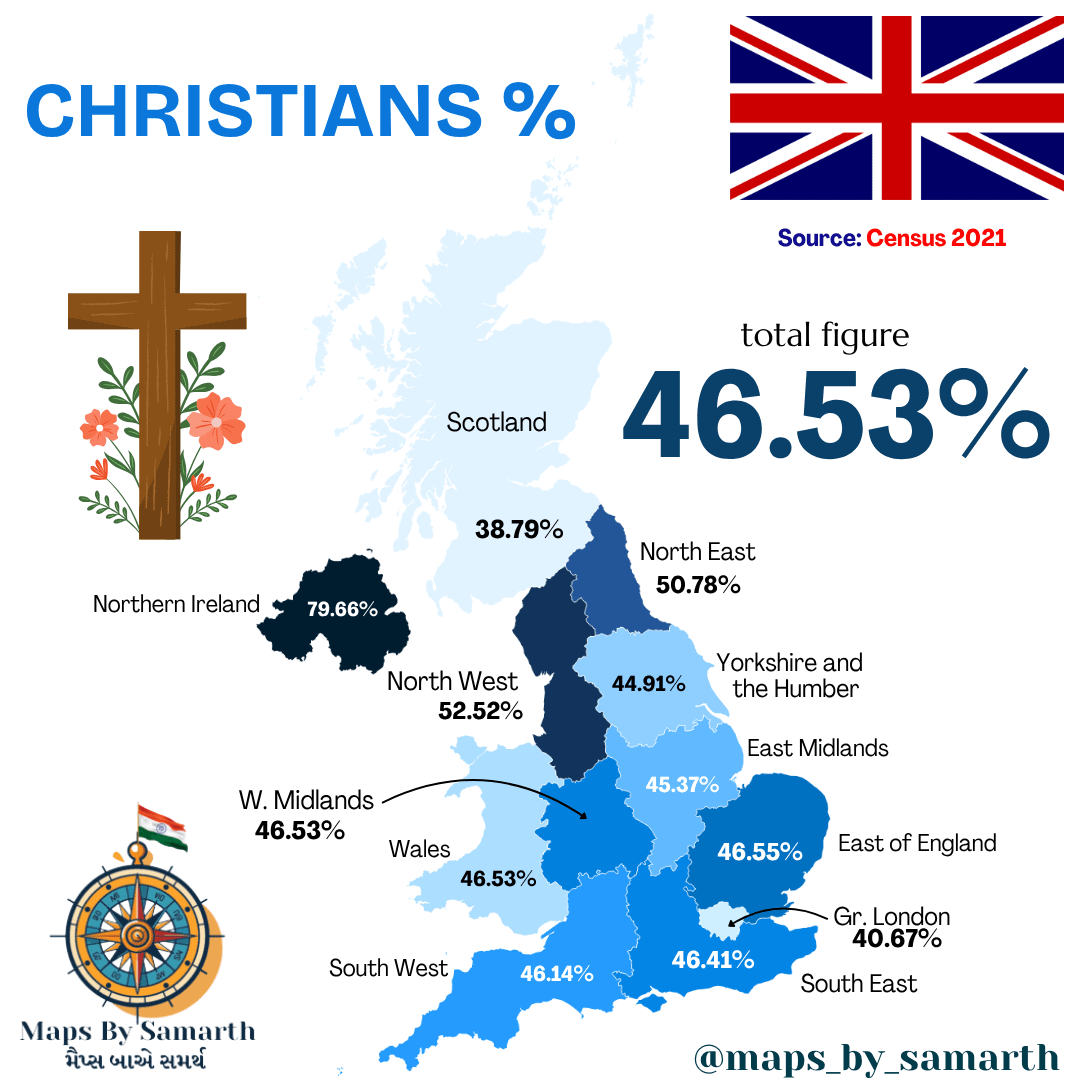
Scotland sits at 38.8% Christian. Greater London is slightly higher at 40.7%. The South East has the most Christians by total count, 4.3 million people. But even there Christians are only 46.4% of residents. Most of Wales and England fall between 44% and 50%.
| Region | Christian Population | % Christian | Total Population | % of UK Christians |
|---|---|---|---|---|
| South East | 4,313,319 | 46.41% | 9,293,943 | 13.85% |
| North West | 3,895,779 | 52.52% | 7,417,706 | 12.51% |
| Greater London | 3,577,681 | 40.67% | 8,796,855 | 11.49% |
| East of England | 2,955,071 | 46.55% | 6,348,165 | 9.49% |
| West Midlands | 2,770,559 | 46.53% | 5,954,350 | 8.89% |
| South West | 2,635,872 | 46.14% | 5,712,770 | 8.46% |
| Yorkshire and the Humber | 2,461,519 | 44.91% | 5,481,004 | 7.90% |
| East Midlands | 2,214,151 | 45.37% | 4,880,209 | 7.11% |
| Scotland | 2,110,405 | 38.79% | 5,440,590 | 6.78% |
| Northern Ireland | 1,516,147 | 79.66% | 1,903,273 | 4.87% |
| Wales | 1,354,773 | 46.53% | 2,911,612 | 4.35% |
| North East | 1,343,948 | 50.78% | 2,646,609 | 4.31% |
| UK Total | 31,149,224 | 46.53% | 66,944,389 | 100.00% |
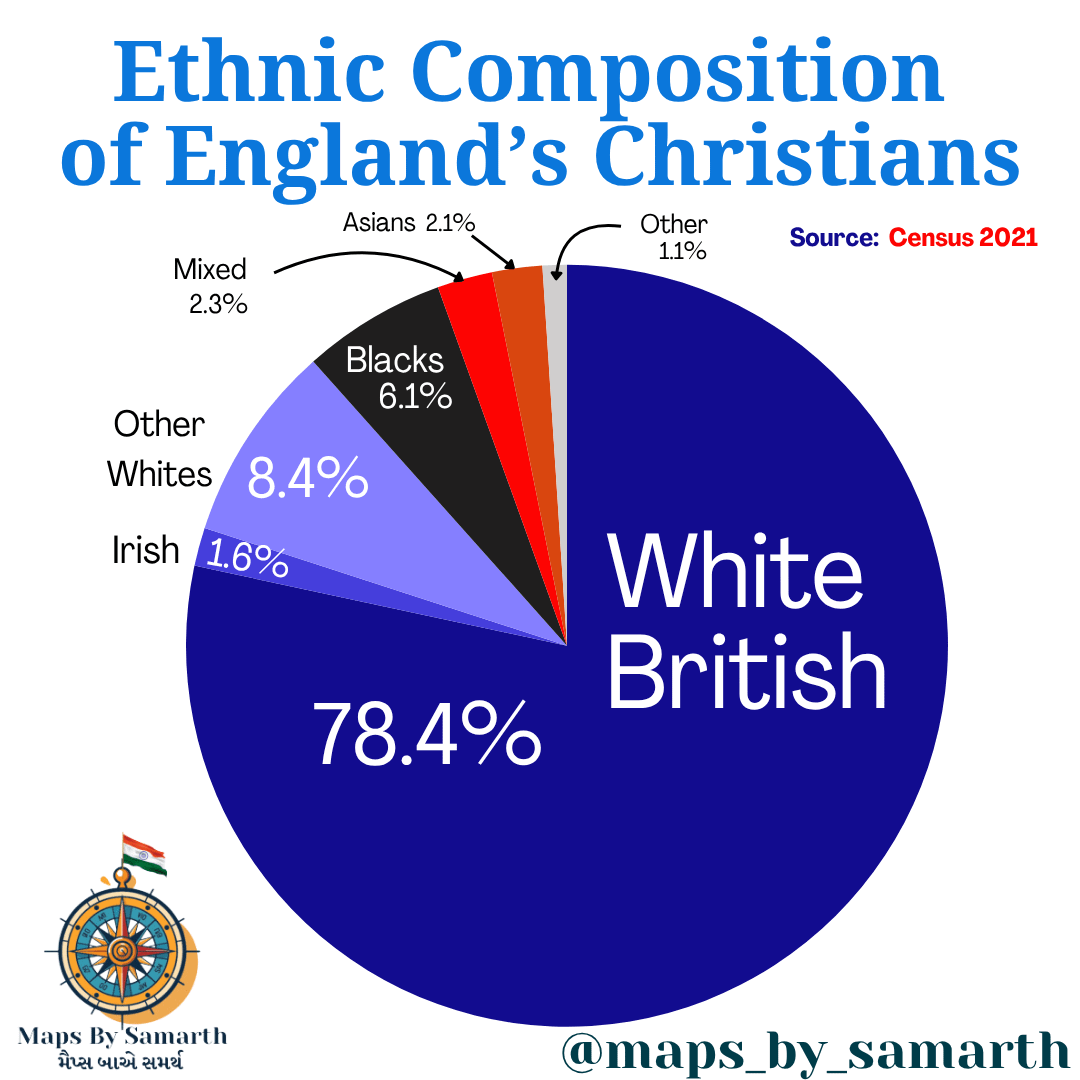
The ethnic makeup of England’s Christians has shifted over time. White British people are 78% of the group. Other White populations, many from Eastern Europe, account for 8%. Black Christians are 6% of the total, Asian Christians 2%.
Where Non-Religious Identity Is Highest
Scotland leads here. 51.1% of Scots identify as having no religion. Wales reaches 46.6%. The South West of England hits 44%.
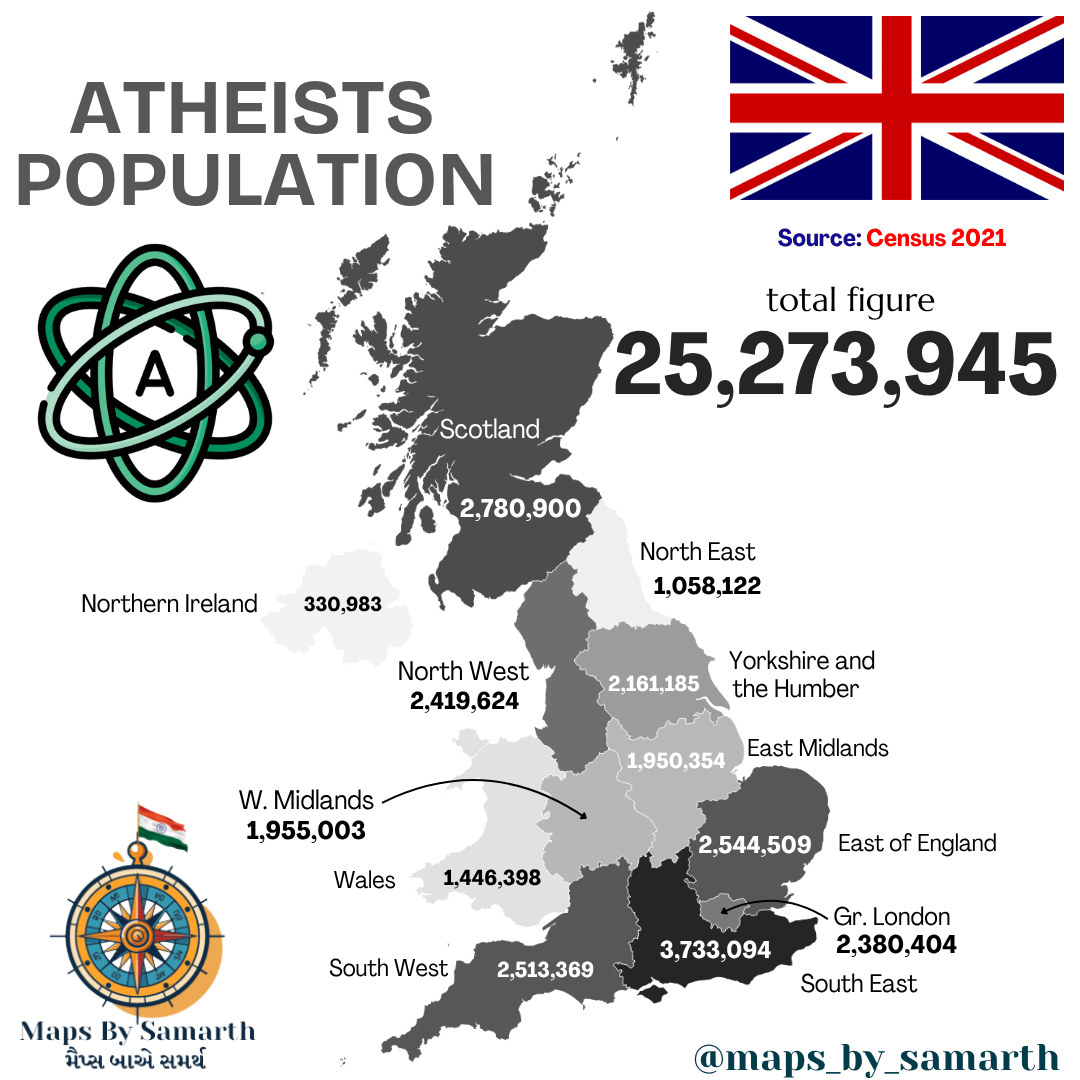
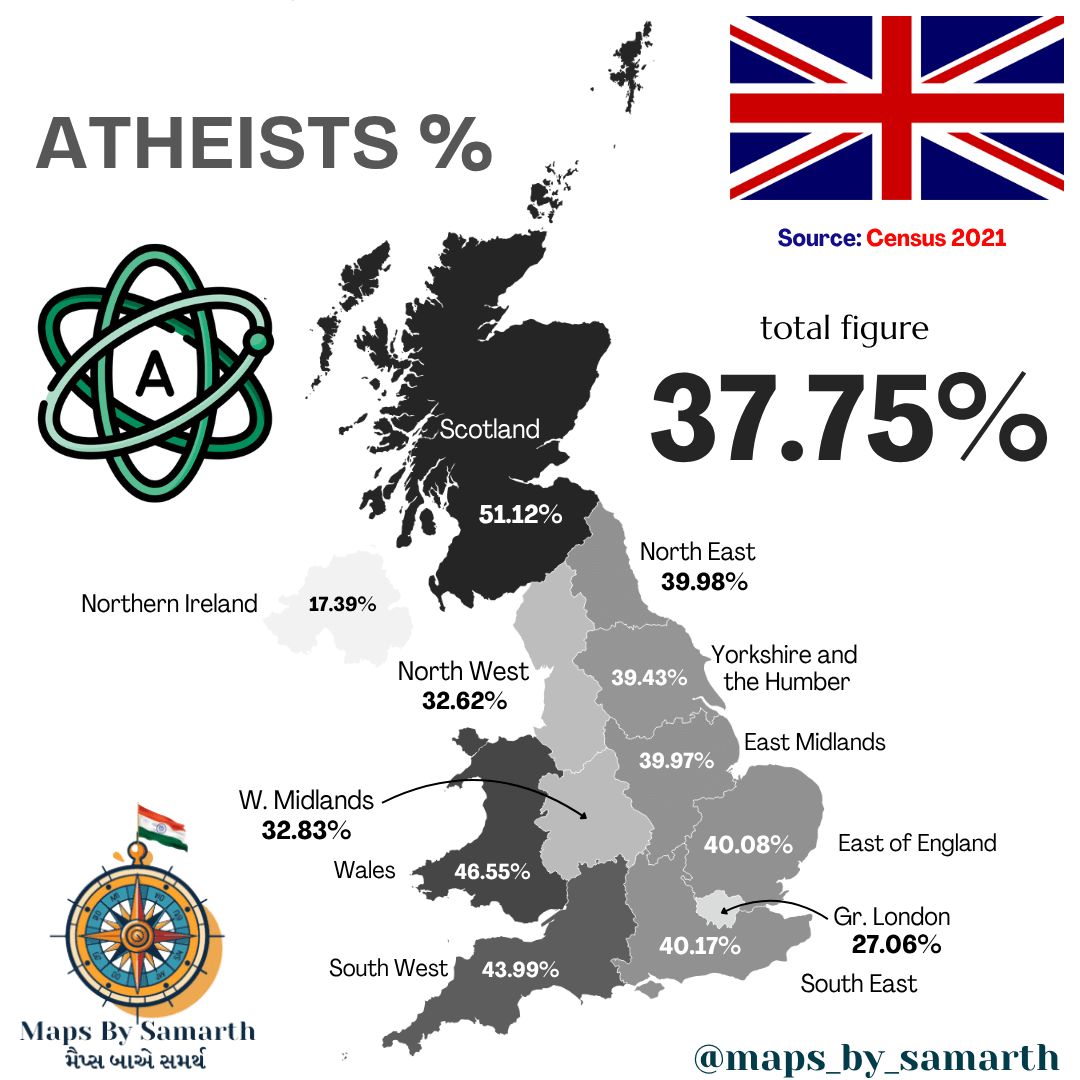
Northern Ireland sits at just 17.4% non-religious. The North West has Manchester and Liverpool but is only 32.6% non-religious. London? Just 27%, below the national average.
| Region | No Religion Population | % No Religion | Total Population | % of UK No Religion |
|---|---|---|---|---|
| South East | 3,733,094 | 40.17% | 9,293,943 | 14.77% |
| Scotland | 2,780,900 | 51.12% | 5,440,590 | 11.00% |
| East of England | 2,544,509 | 40.08% | 6,348,165 | 10.07% |
| South West | 2,513,389 | 43.99% | 5,712,770 | 9.95% |
| North West | 2,419,624 | 32.62% | 7,417,706 | 9.57% |
| Gr. London | 2,380,404 | 27.06% | 8,796,855 | 9.42% |
| Yorkshire and the Humber | 2,161,185 | 39.43% | 5,481,004 | 8.55% |
| W. Midlands | 1,955,003 | 32.83% | 5,954,350 | 7.74% |
| East Midlands | 1,950,354 | 39.97% | 4,880,209 | 7.72% |
| Wales | 1,446,398 | 46.55% | 2,911,612 | 5.72% |
| North East | 1,058,122 | 39.98% | 2,646,609 | 4.19% |
| Northern Ireland | 330,983 | 17.39% | 1,903,273 | 1.31% |
| UK Total | 25,273,945 | 37.75% | 66,944,389 | 100.00% |
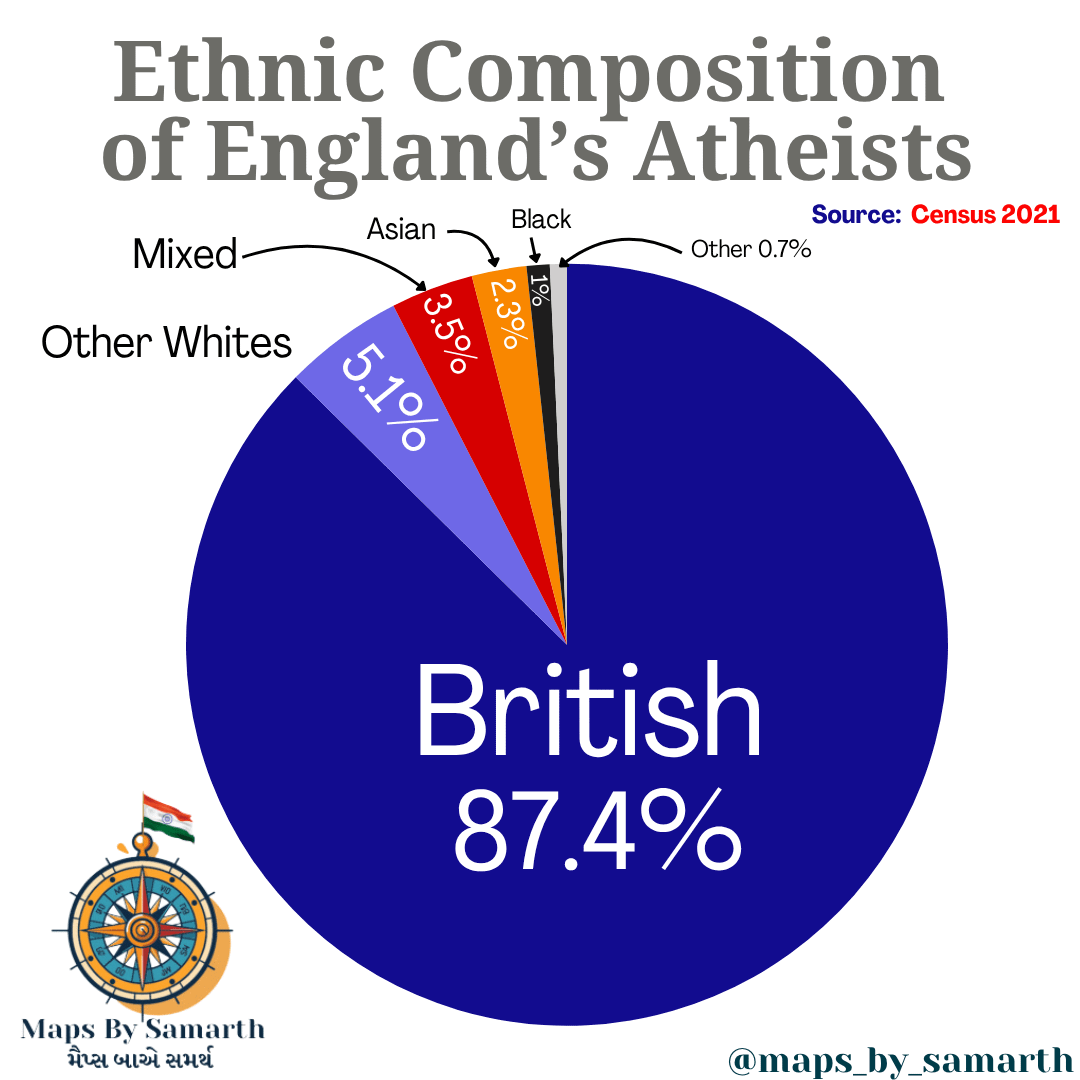
Most of the UK atheists are British.
Muslim Communities
London contains 1.3 million Muslims. They represent 15% of people living in the capital. About a third of all British Muslims live in London. The West Midlands reaches 9.6% Muslim. In the North West it’s 7.6%.

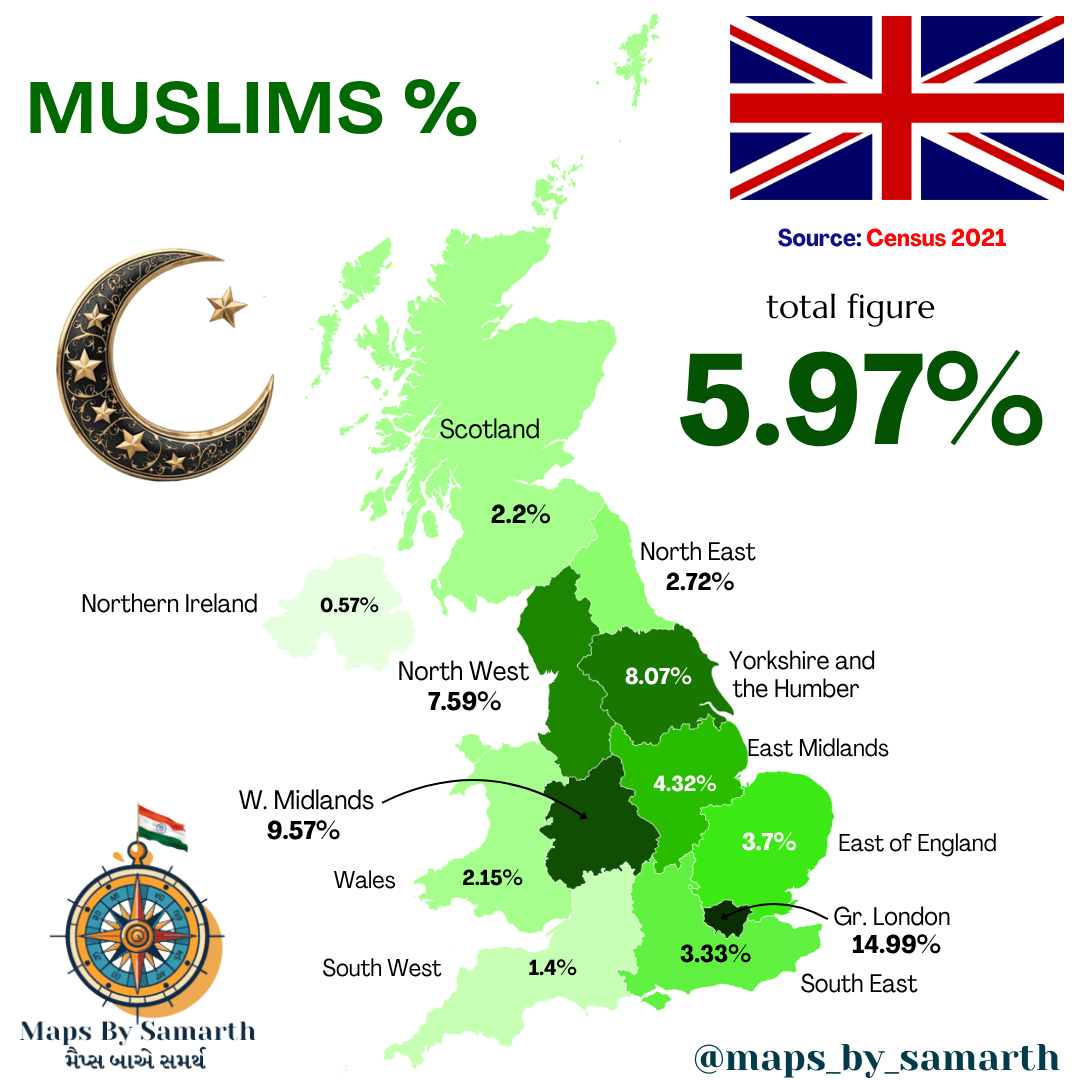
Scotland’s Muslim population is much smaller at 2.2%. Northern Ireland barely hits 0.6%.
| Region | Muslim Population | % Muslim | Total Population | % of UK Muslims |
|---|---|---|---|---|
| Gr. London | 1,318,754 | 14.99% | 8,796,855 | 32.98% |
| W. Midlands | 569,963 | 9.57% | 5,954,350 | 14.25% |
| North West | 563,105 | 7.59% | 7,417,706 | 14.08% |
| Yorkshire and the Humber | 442,533 | 8.07% | 5,481,004 | 11.07% |
| South East | 309,067 | 3.33% | 9,293,943 | 7.73% |
| East of England | 234,744 | 3.70% | 6,348,165 | 5.87% |
| East Midlands | 210,766 | 4.32% | 4,880,209 | 5.27% |
| Scotland | 119,872 | 2.20% | 5,440,590 | 3.00% |
| South West | 80,152 | 1.40% | 5,712,770 | 2.00% |
| North East | 72,102 | 2.72% | 2,646,609 | 1.80% |
| Wales | 66,947 | 2.15% | 2,911,612 | 1.67% |
| Northern Ireland | 10,870 | 0.57% | 1,903,273 | 0.27% |
| UK Total | 3,998,875 | 5.97% | 66,944,389 | 100.00% |
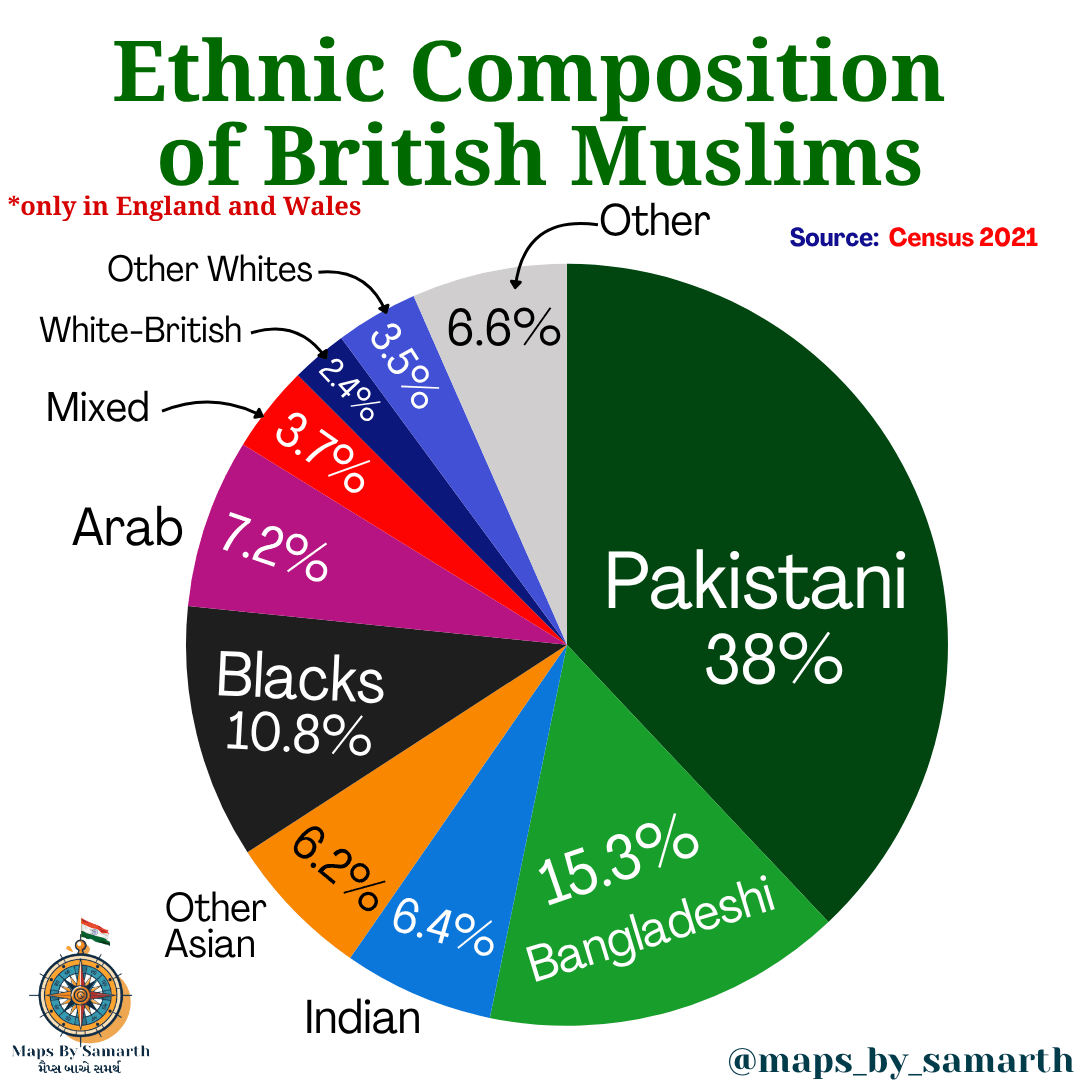
The ethnic backgrounds vary within the Muslim community. People of Pakistani heritage form the largest group at 38%. Bangladeshis are the second largest at 15.3%. Black Muslims account for 10.8% of the community. Arabs make up 7.2%, Indians 6.4%.
Hindus
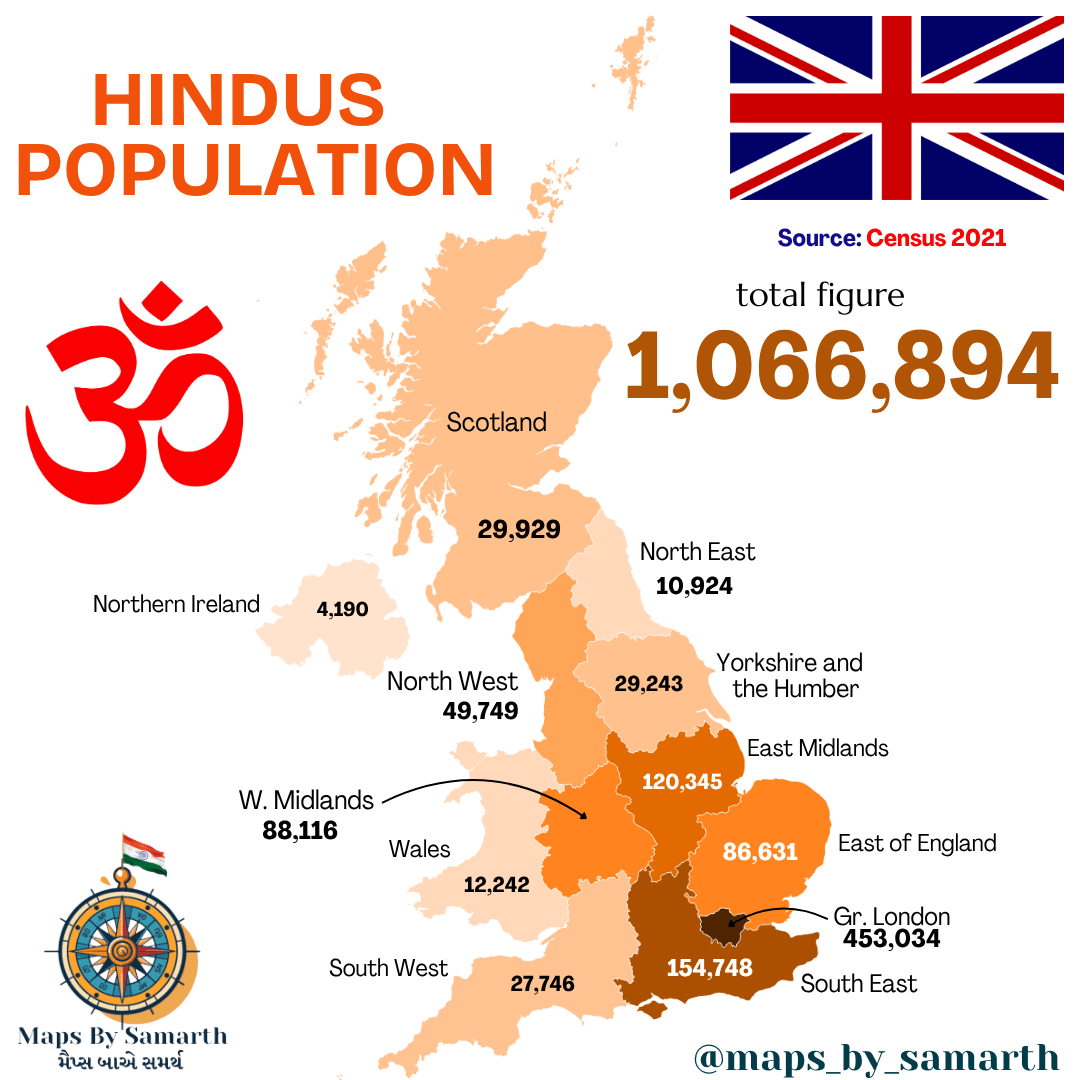
London dominates. The capital has 42% of all British Hindus. Add the South East and that’s 57% of the Hindu population in two regions. Scotland has under 30,000 Hindus. Northern Ireland has around 4,000.
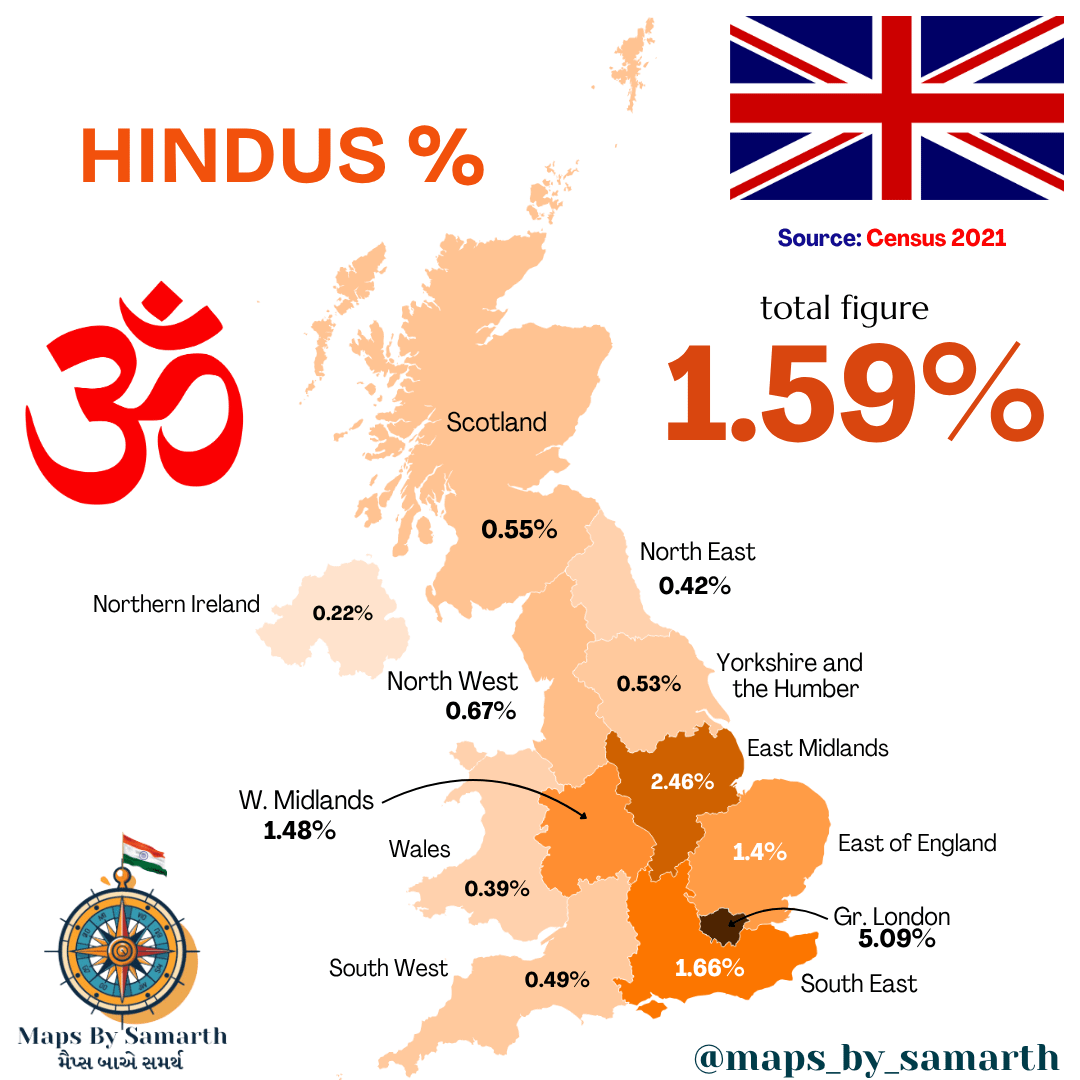
| Region | Hindu Population | % Hindu | Total Population | % of UK Hindus |
|---|---|---|---|---|
| Gr. London | 453,034 | 5.09% | 8,796,855 | 42.47% |
| South East | 154,748 | 1.66% | 9,293,943 | 14.51% |
| East Midlands | 120,345 | 2.46% | 4,880,209 | 11.28% |
| W. Midlands | 88,116 | 1.48% | 5,954,350 | 8.26% |
| East of England | 86,631 | 1.40% | 6,348,165 | 8.12% |
| North West | 49,749 | 0.67% | 7,417,706 | 4.66% |
| Scotland | 29,929 | 0.55% | 5,440,590 | 2.81% |
| Yorkshire and the Humber | 29,243 | 0.53% | 5,481,004 | 2.74% |
| South West | 27,746 | 0.49% | 5,712,770 | 2.60% |
| Wales | 12,242 | 0.39% | 2,911,612 | 1.15% |
| North East | 10,924 | 0.42% | 2,646,609 | 1.02% |
| Northern Ireland | 4,190 | 0.22% | 1,903,273 | 0.39% |
| UK Total | 1,066,894 | 1.59% | 66,944,389 | 100.00% |
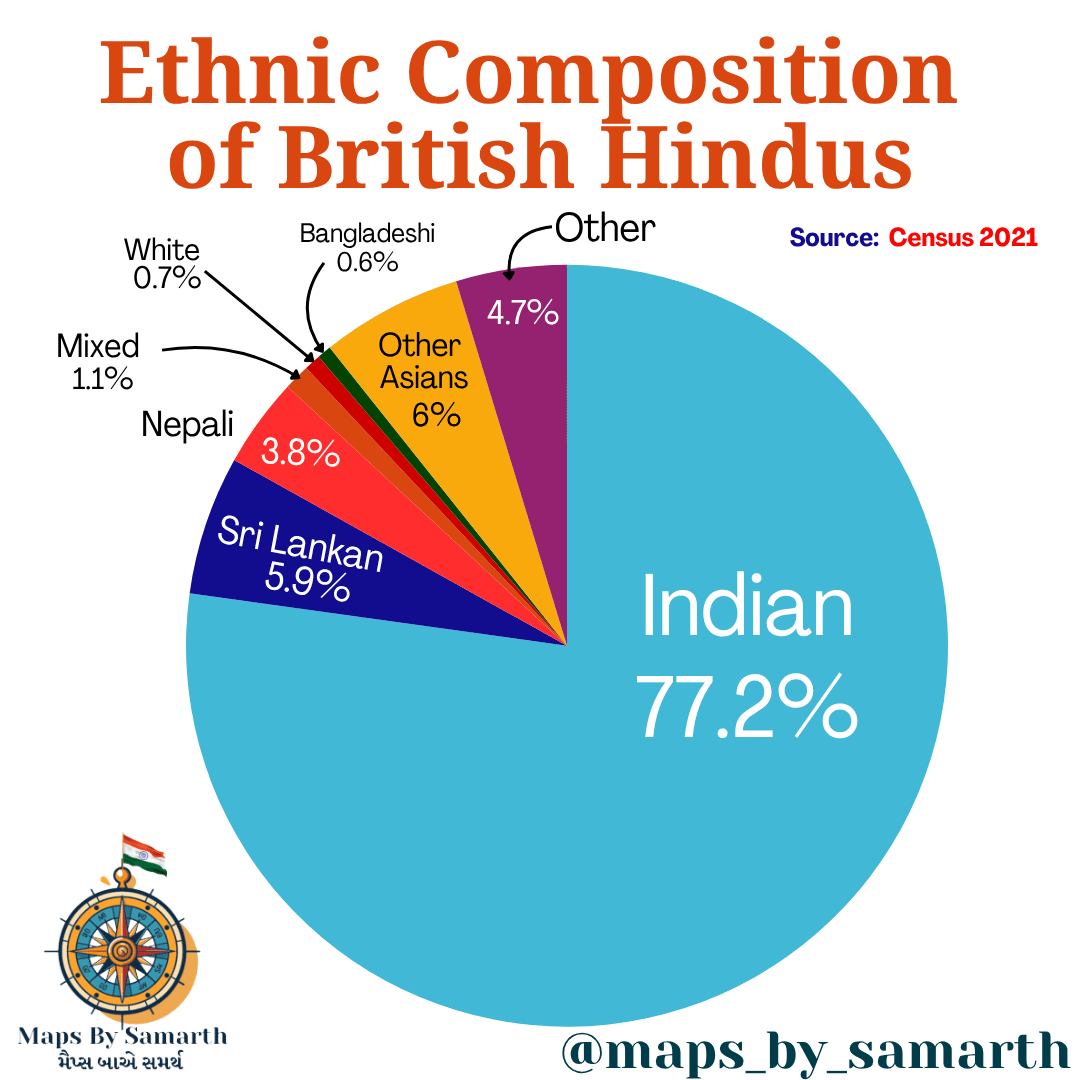
Most British Hindus trace heritage to India (77%). Sri Lankan Tamils are 6% of the community. Nepalis make up nearly 4%.
Sikhs
The West Midlands has 32% of British Sikhs. That’s the strongest regional concentration of any major religious group in the entire UK. London contains another 27% of Sikhs.
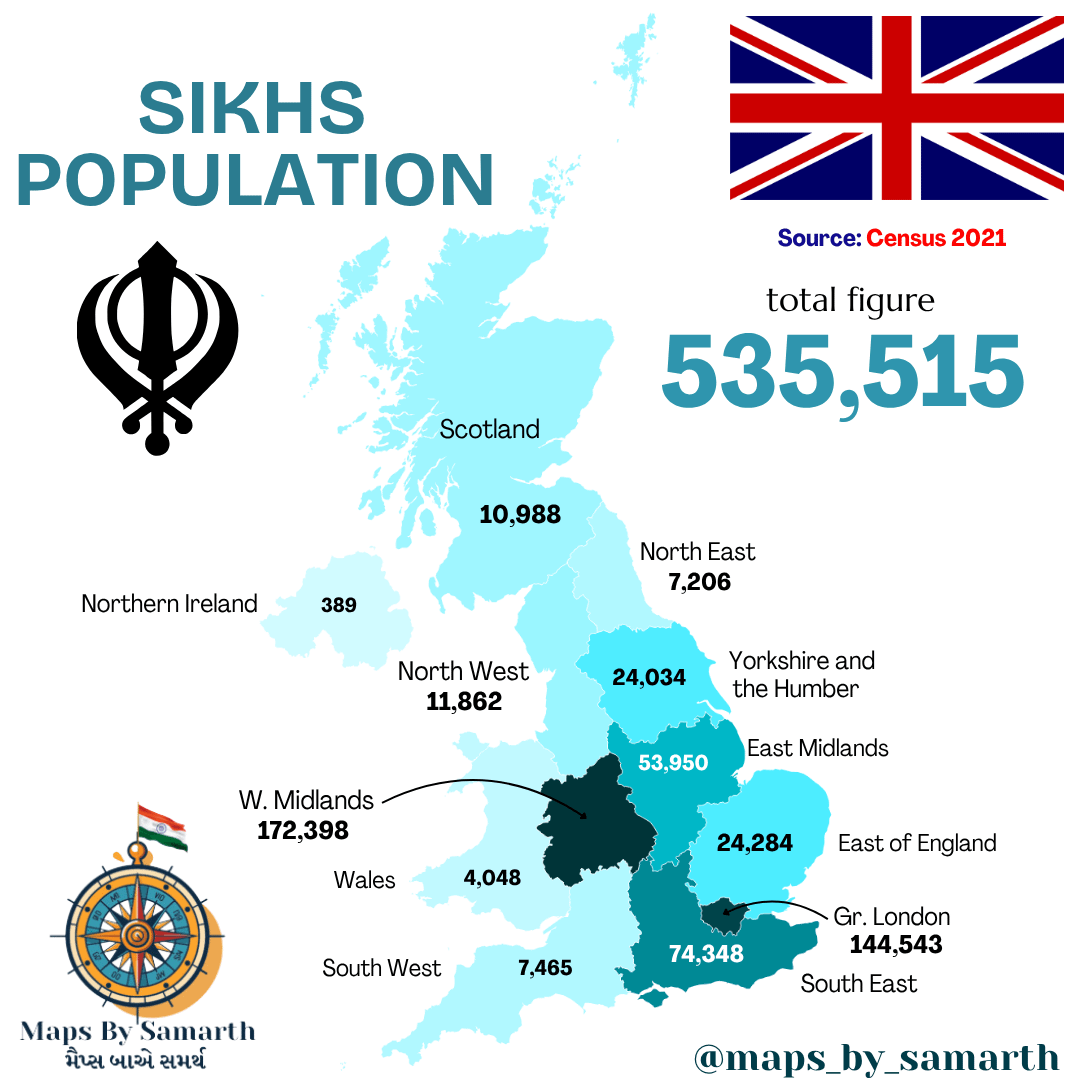
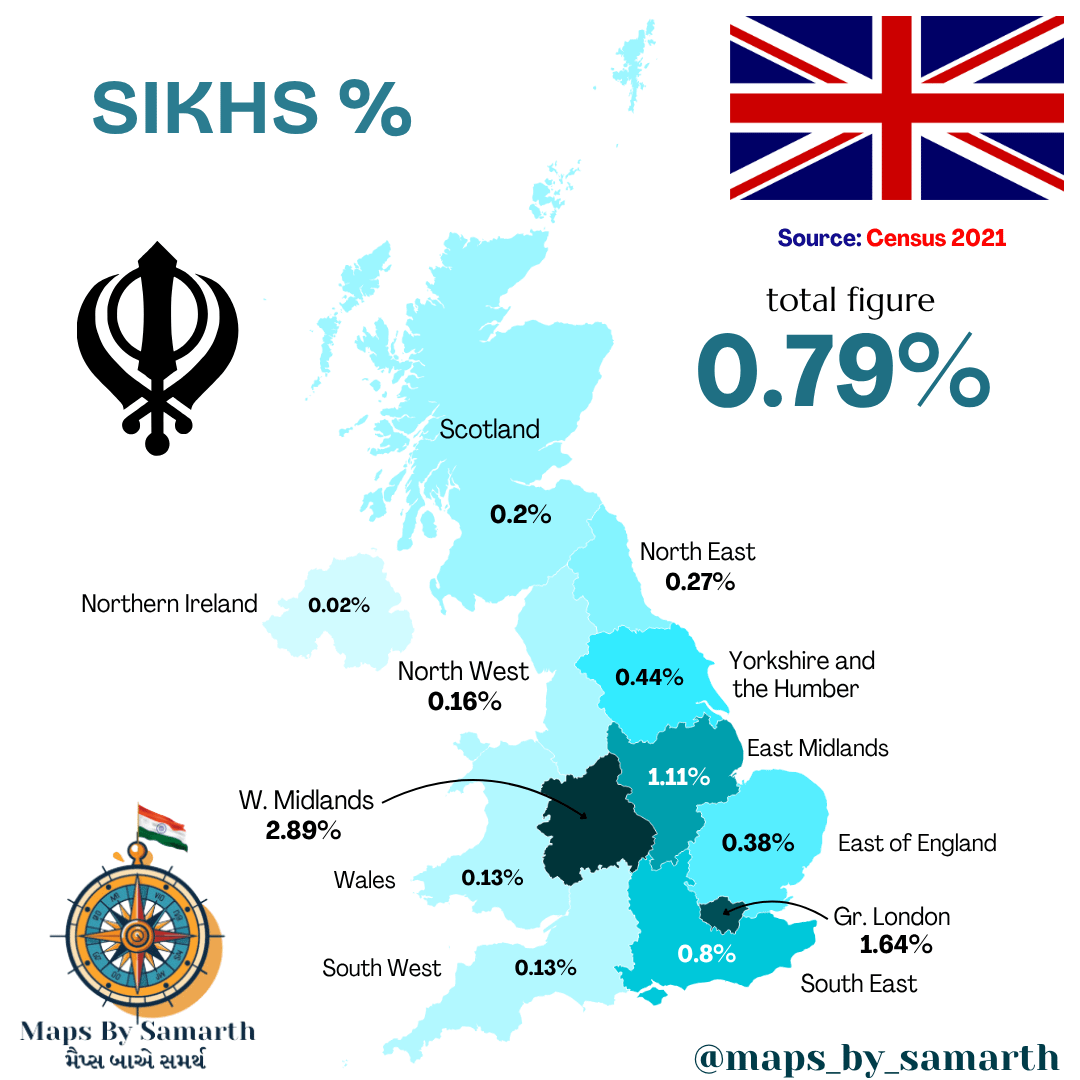
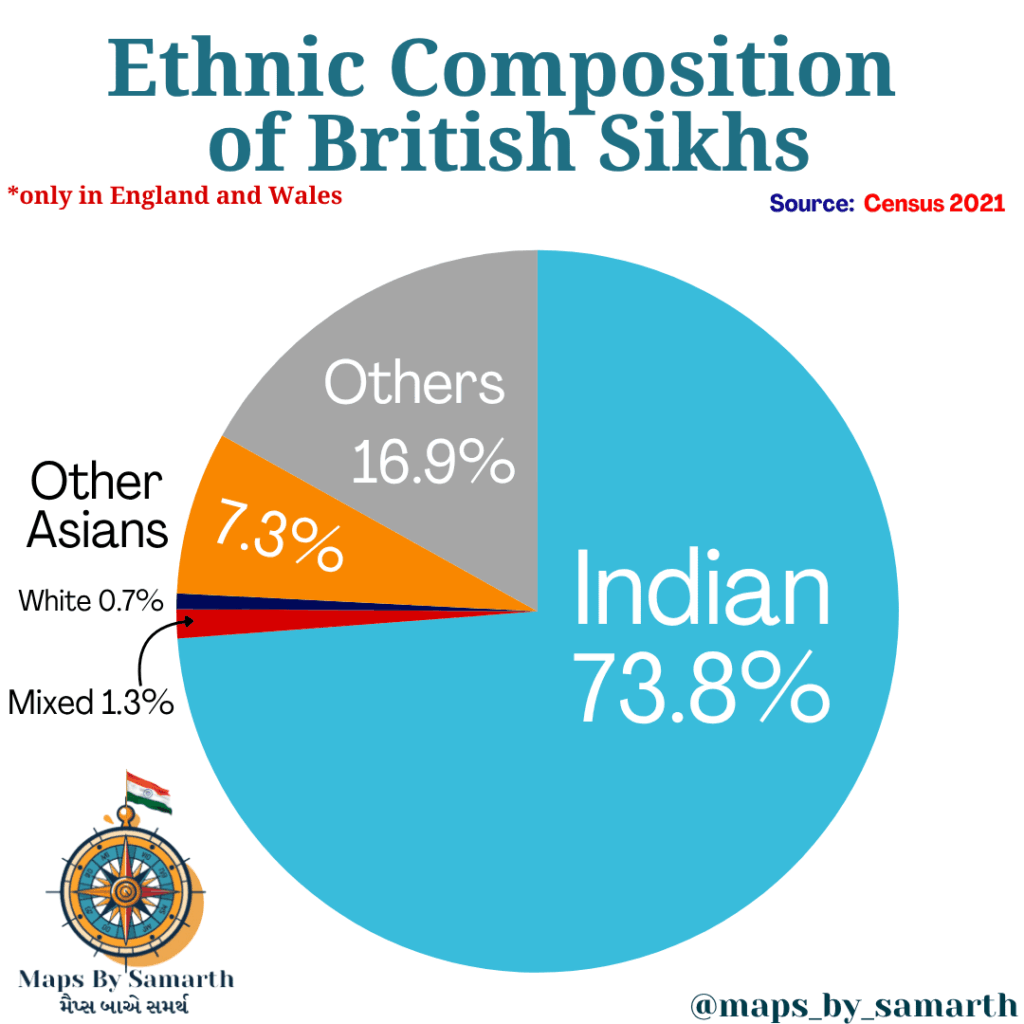
The pattern traces back decades. Birmingham and Wolverhampton had booming factories in the 1950s and 60s. They needed workers and recruited from Punjab. Those early arrivals formed communities. Families joined them. About 74% of British Sikhs have Indian heritage today.
| Region | Sikh Population | % Sikh | Total Population | % of UK Sikhs |
|---|---|---|---|---|
| W. Midlands | 172,398 | 2.89% | 5,954,350 | 32.19% |
| Gr. London | 144,543 | 1.64% | 8,796,855 | 27.00% |
| South East | 74,348 | 0.80% | 9,293,943 | 13.88% |
| East Midlands | 53,950 | 1.11% | 4,880,209 | 10.07% |
| East of England | 24,284 | 0.38% | 6,348,165 | 4.53% |
| Yorkshire and the Humber | 24,034 | 0.44% | 5,481,004 | 4.49% |
| North West | 11,862 | 0.16% | 7,417,706 | 2.22% |
| Scotland | 10,988 | 0.20% | 5,440,590 | 2.05% |
| North East | 7,206 | 0.27% | 2,646,609 | 1.35% |
| South West | 7,465 | 0.13% | 5,712,770 | 1.39% |
| Wales | 4,048 | 0.13% | 2,911,612 | 0.76% |
| Northern Ireland | 389 | 0.02% | 1,903,273 | 0.07% |
| UK Total | 535,515 | 0.79% | 66,944,389 | 100.00% |
Jews and Buddhists
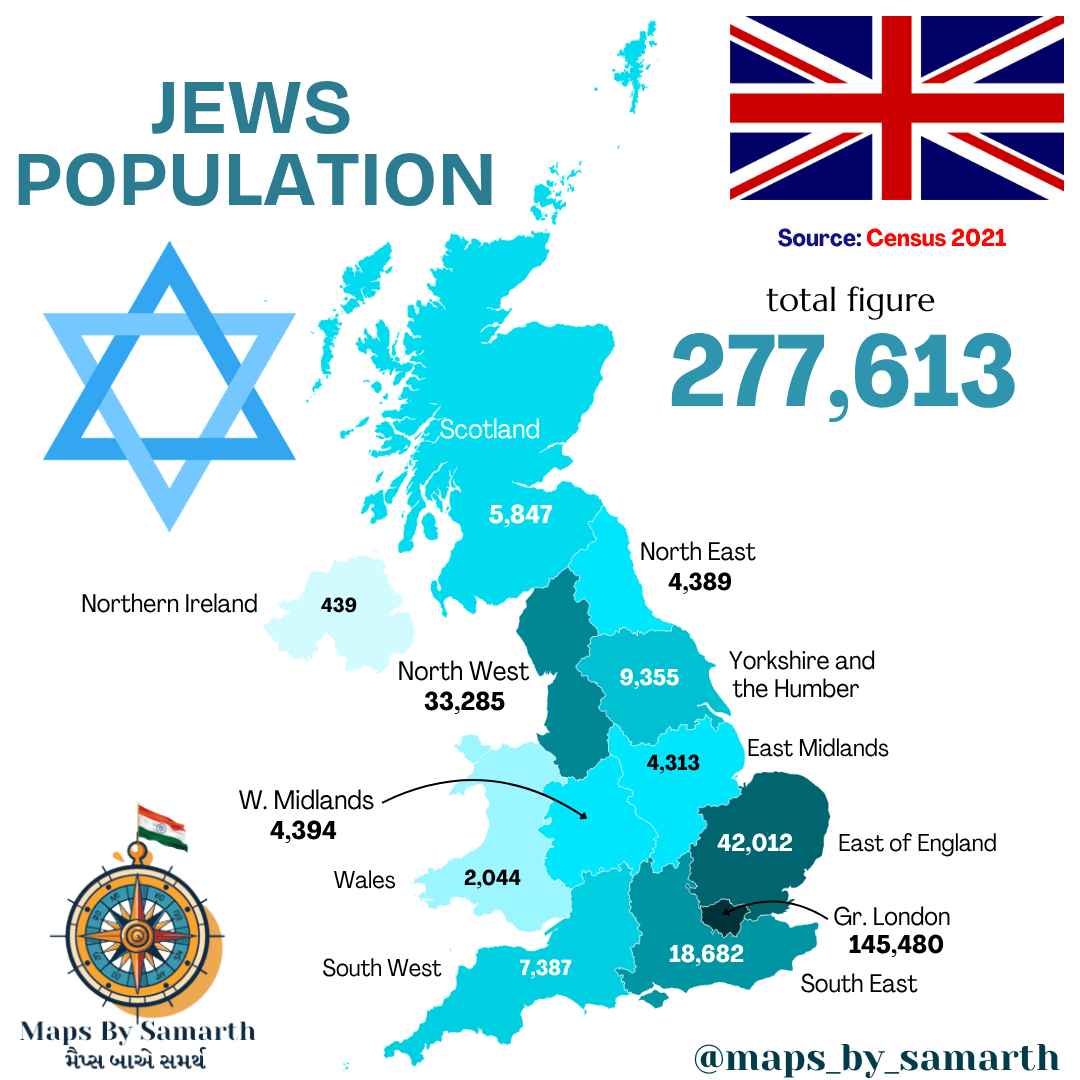
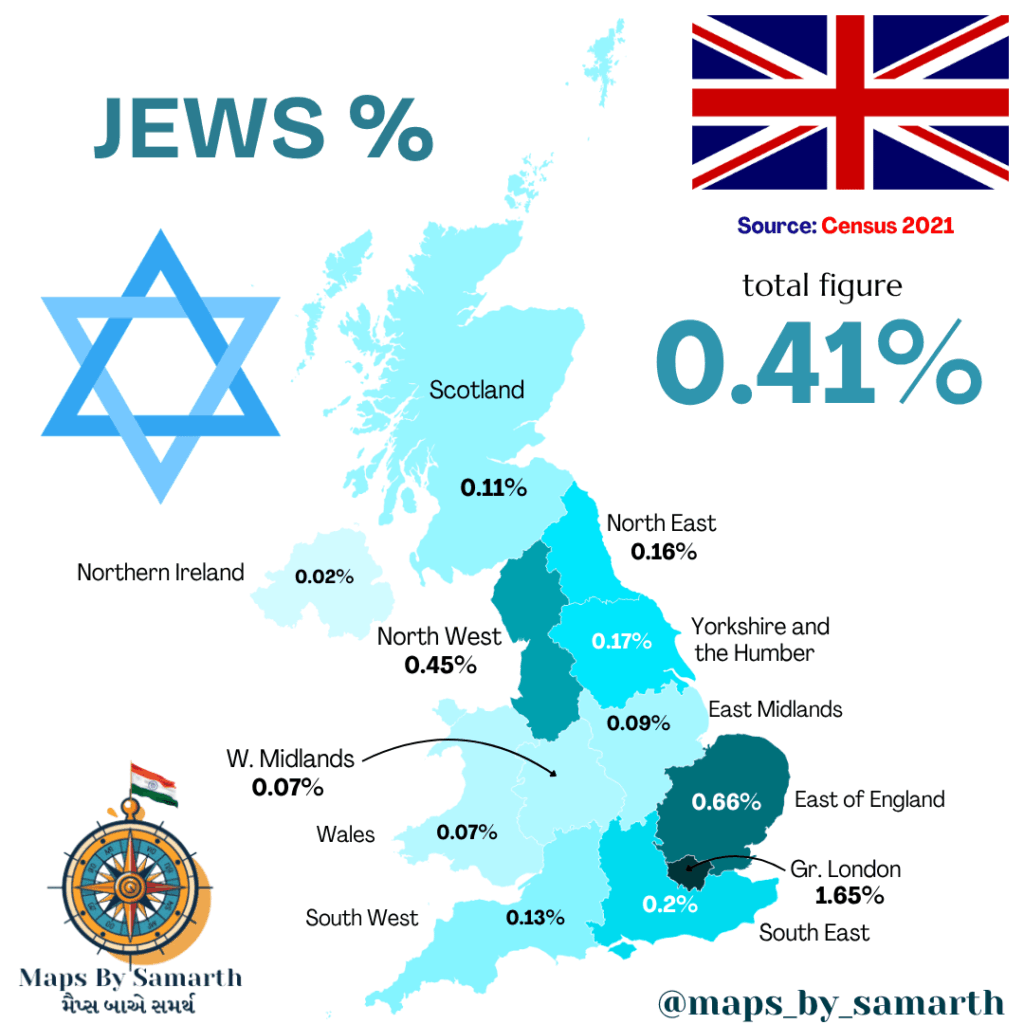
Greater London is home to over half of British Jews (52%). The East of England has another 15%, mostly in Hertfordshire and Essex near London. Put those together and two regions account for 67% of Britain’s 277,613 Jews.
| Region | Jewish Population | % Jewish | Total Population | % of UK Jews |
|---|---|---|---|---|
| Gr. London | 145,480 | 1.65% | 8,796,855 | 52.41% |
| East of England | 42,012 | 0.66% | 6,348,165 | 15.14% |
| North West | 33,285 | 0.45% | 7,417,706 | 11.99% |
| South East | 18,682 | 0.20% | 9,293,943 | 6.73% |
| Yorkshire and the Humber | 9,355 | 0.17% | 5,481,004 | 3.37% |
| South West | 7,387 | 0.13% | 5,712,770 | 2.66% |
| Scotland | 5,847 | 0.11% | 5,440,590 | 2.11% |
| W. Midlands | 4,394 | 0.07% | 5,954,350 | 1.58% |
| East Midlands | 4,313 | 0.09% | 4,880,209 | 1.55% |
| North East | 4,389 | 0.16% | 2,646,609 | 1.58% |
| Wales | 2,044 | 0.07% | 2,911,612 | 0.74% |
| Northern Ireland | 439 | 0.02% | 1,903,273 | 0.16% |
| UK Total | 277,613 | 0.41% | 66,944,389 | 100.00% |
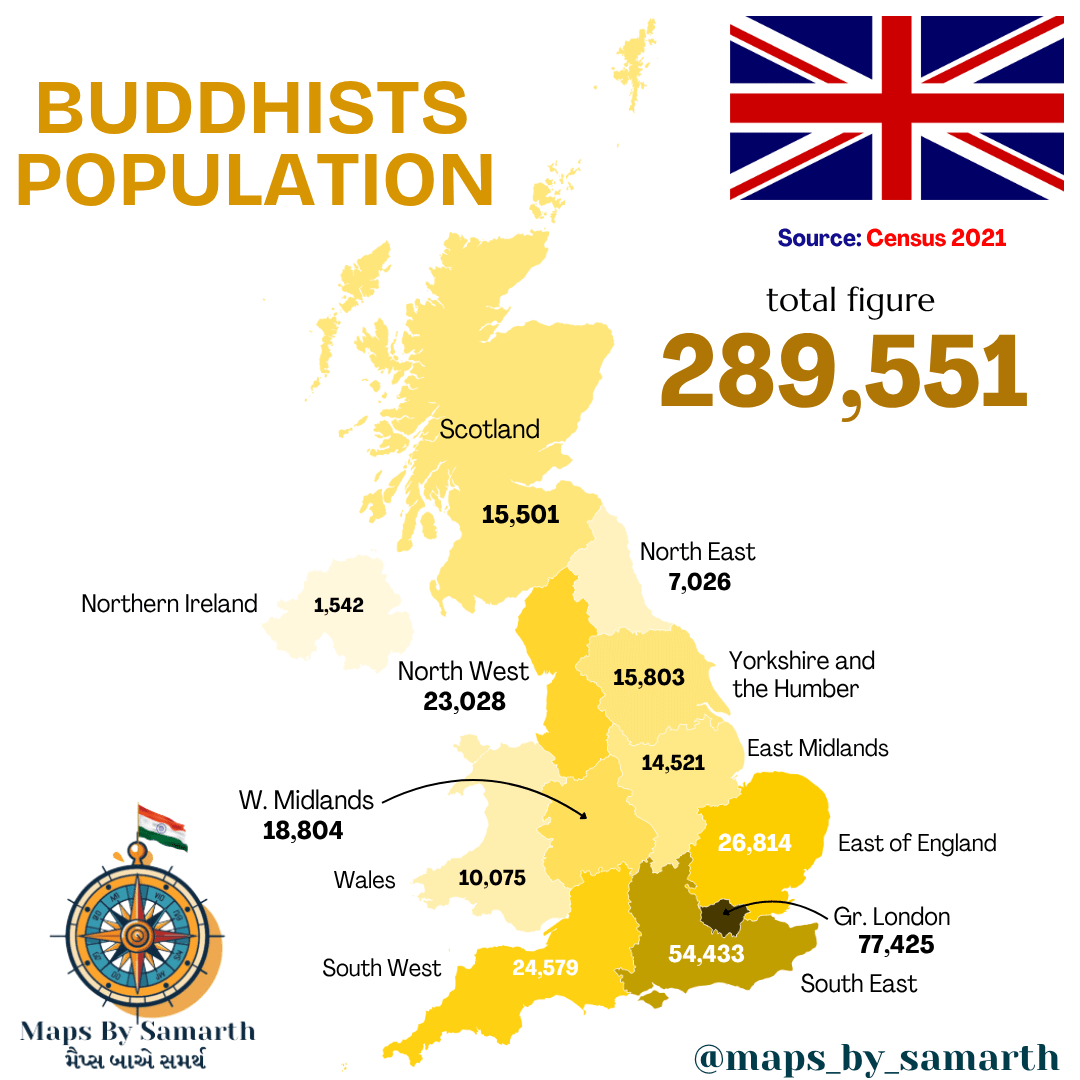
Buddhists are more geographically dispersed. The South East contains 27% of them. London has 19%. The East of England accounts for 9%.
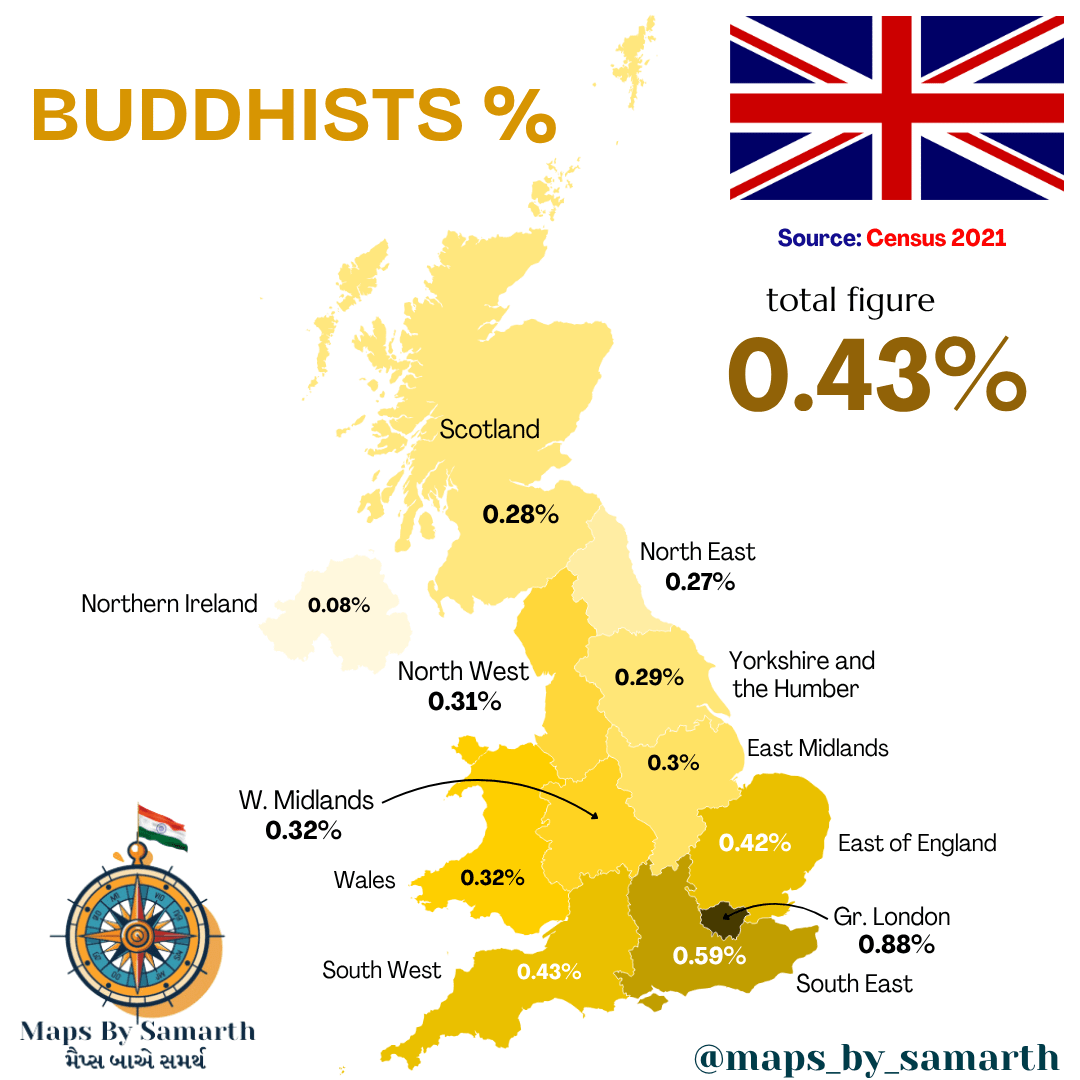
| Region | Buddhist Population | % Buddhist | Total Population | % of UK Buddhists |
|---|---|---|---|---|
| South East | 77,425 | 0.88% | 9,293,943 | 26.73% |
| Gr. London | 54,433 | 0.59% | 8,796,855 | 18.80% |
| East of England | 26,814 | 0.42% | 6,348,165 | 9.26% |
| South West | 24,579 | 0.43% | 5,712,770 | 8.49% |
| North West | 23,028 | 0.31% | 7,417,706 | 7.95% |
| W. Midlands | 18,804 | 0.32% | 5,954,350 | 6.49% |
| Yorkshire and the Humber | 15,803 | 0.29% | 5,481,004 | 5.46% |
| Scotland | 15,501 | 0.28% | 5,440,590 | 5.35% |
| East Midlands | 14,521 | 0.30% | 4,880,209 | 5.01% |
| Wales | 10,075 | 0.32% | 2,911,612 | 3.48% |
| North East | 7,026 | 0.27% | 2,646,609 | 2.43% |
| Northern Ireland | 1,542 | 0.08% | 1,903,273 | 0.53% |
| UK Total | 289,551 | 0.43% | 66,944,389 | 100.00% |