Arctic sea ice minimum volumes (1979 – 2015)
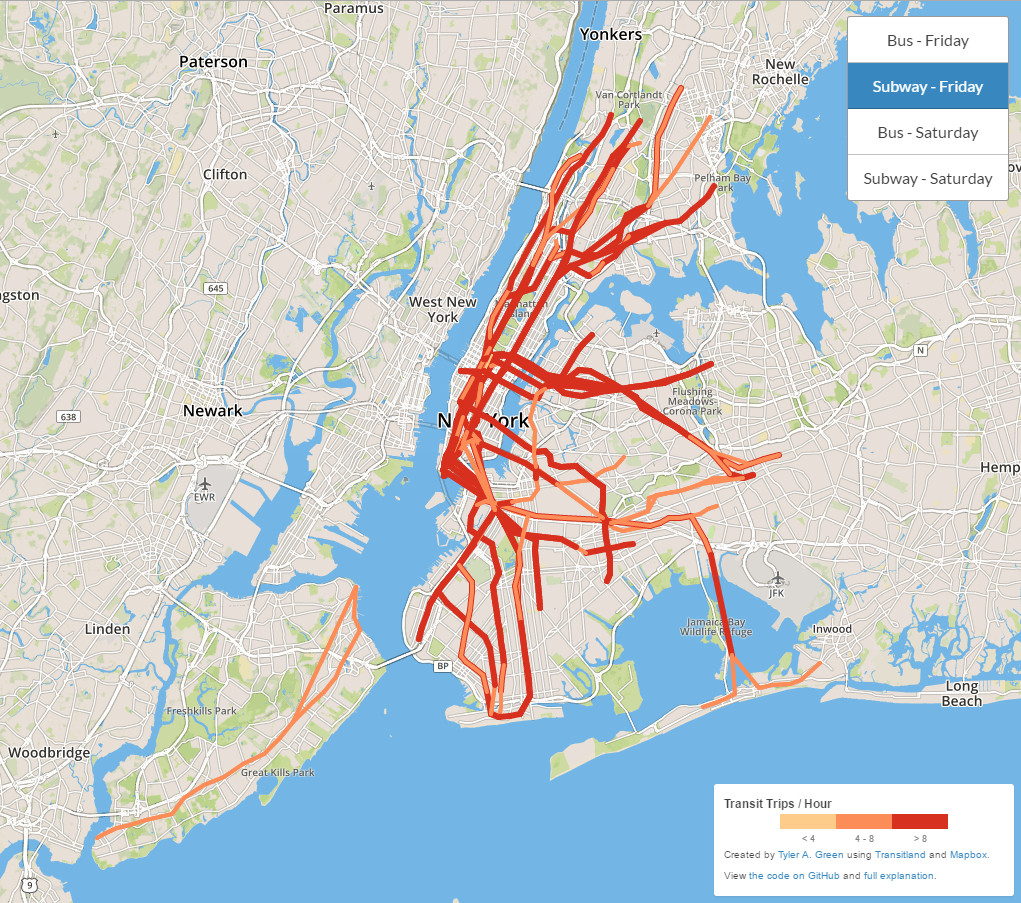
This is an animated visualization of the startling decline of Arctic Sea Ice, showing the minimum volume reached every September since 1979, set on a map of New York with a 10km grid to give an idea of scale. It is clear that the trend of Arctic sea ice decline indicates that it’ll be ice-free for an increasingly large part of the year, with consequences for the climate.


