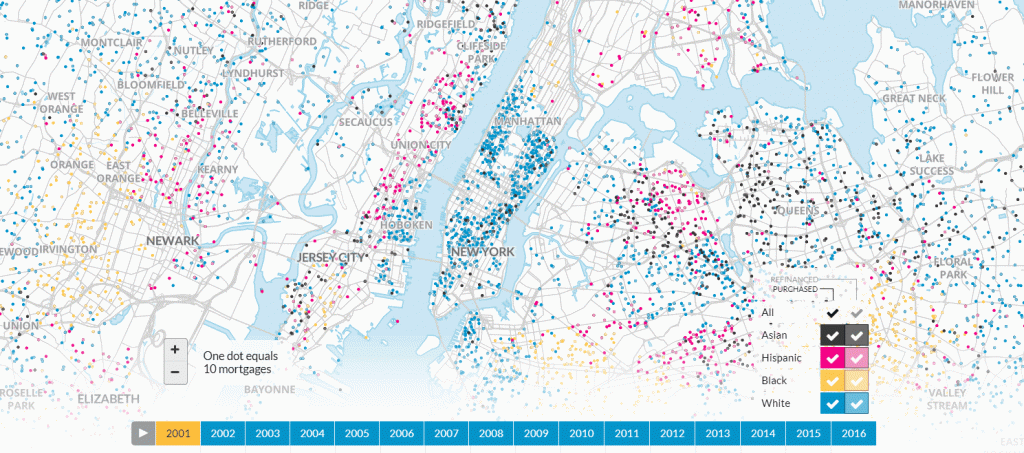
An interactive view of the housing boom and bust in the U.S.
The map below was originally published in September 2013 and has been updated annually as new Home Mortgage Disclosure Act data become available. This 2017 update incorporates 2016 mortgage originations and includes information on purchase and refinance loans.
Since 2008, the tight credit environment has constrained mortgage lending and disproportionately affected black and Hispanic households. As a result, these communities found it hard to take advantage of the low home prices and low-interest rates that followed the housing market crash, missing an important opportunity to build wealth through homeownership. Credit remains tight today while home prices have reached their pre-crisis peak, further limiting affordable housing options for minority homebuyers.

