Difference in GDP Per Capita Along The Worlds Borders
Top 15 Largest Border Differences in USD (GDP per capita) Richer Country vs Poorer Country Qatar (102,100) – Saudi Arabia
Read more: Difference in GDP Per Capita Along The Worlds Borders
Maps to explain economic geography.
Top 15 Largest Border Differences in USD (GDP per capita) Richer Country vs Poorer Country Qatar (102,100) – Saudi Arabia
Read more: Difference in GDP Per Capita Along The Worlds BordersThe debt-to-GDP ratio is the ratio between a country’s government debt and its gross domestic product measured in years. A
Read more: Development of the Debt-to-GDP ratio worldwide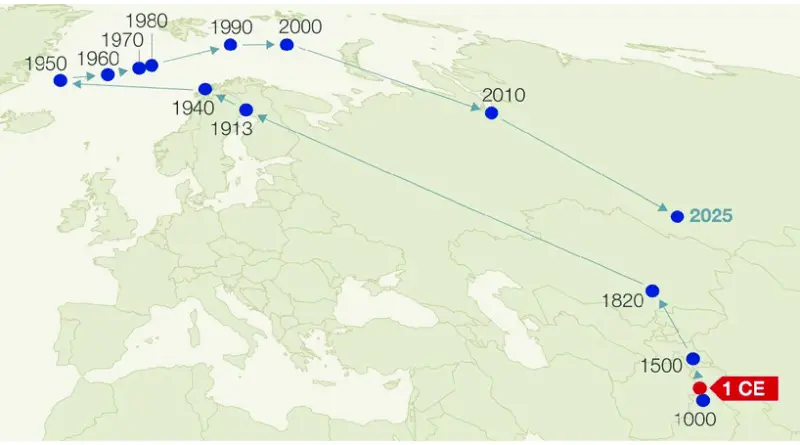
The ranking of the most advanced economic countries has witnessed significant shifts throughout history. In ancient times, civilizations like those in Mesopotamia, Egypt, and China were economically advanced. During the Middle Ages, European countries like Italy and the Low Countries experienced economic prosperity through trade and commerce.
Read more: The changing center of economic gravityRed: Corporate Tax, Blue: Maximum Income Tax, Green: VAT
Read more: Tax rates in Europe
High-income regions with the highest GDP are almost entirely concentrated in a few temperate zones, and 15% of the global population produces half of the world’s GDP.
Read more: Distribution of GDP in the world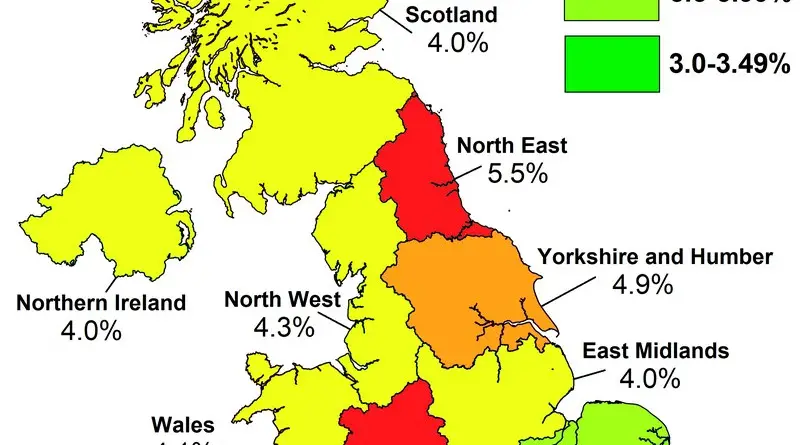
The Office for National Statistics (ONS) measures unemployment in the UK, and in the 3 months to May 2017, the headline unemployment rate held at almost 1.5 million people (4.5%). It is a decrease in jobless people of 152 thousand from a year afore, and this is the lowest unemployment rate since 1975.
Read more: Unemployment in the UKChina is the world’s biggest exporter. China exported a $2 trillion value of goods across the globe. China estimates a notable proportion of world trade in natural resources such as coal, copper, aluminum, and iron ore. Today China mostly exports computers, electrical equipment, and other types of machinery.
Read more: From Where Countries Import The Most?Predictably, much of the global economy runs on oil, especially the Middle East and some Central Asian countries. In general, developing countries export raw materials, developed countries export goods.
Read more: Every Country’s Highest-Valued Export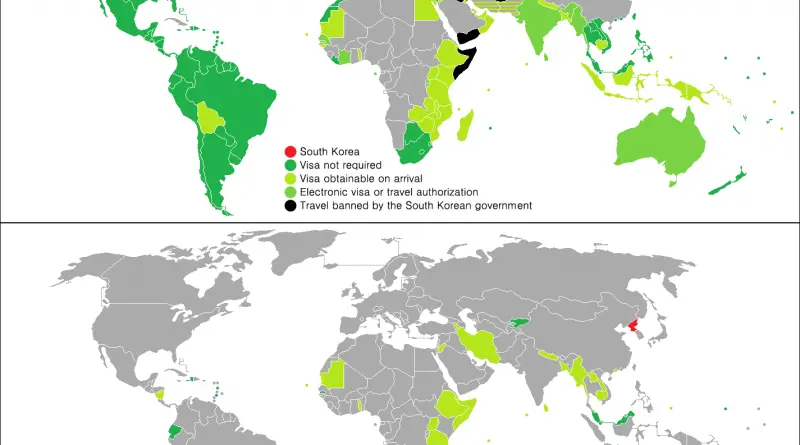
The Division of Korea started at the end of WWII in 1945. The USSR controlled the North of Korea, and the U.S. held South Korea. As a result, North and South Korea have been divided for more than 75 years. All this time, countries have been developing in opposite directions. Now the impact of this development is visible even from space.
Read more: North Korea vs. South KoreaSee how U.S. states and Chinese provinces stack up economically from 1960 to 2026 in this animated GDP (PPP) map based on World Bank, IMF, and official Chinese data.
Read more: Comparing the Economies of U.S. States and Chinese Provinces: 1960 to 2026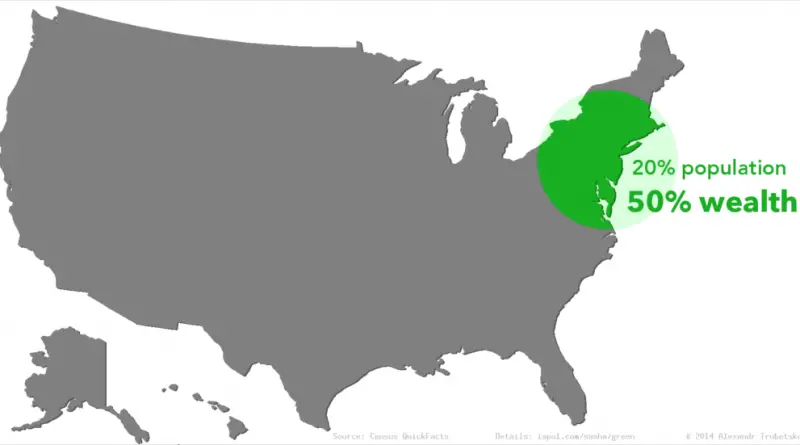
At 3.8 million square miles (9.8 million square kilometers) and a population of about 332 million people, the United States is the world’s 3d-largest country by total area and 3rd most populous country in the world. The country consists of 50 states, one federal district, 5 major unincorporated territories.
Read more: 15 maps about America worth bringing up at dinner parties or first dates