Countries with similar GDP
Comparison within U.S. states and world countries’ nominal GDP based on Bureau of Economic Analysis data. Many of the U.S.
Read more: Countries with similar GDP
Maps to explain economic geography.

Comparison within U.S. states and world countries’ nominal GDP based on Bureau of Economic Analysis data. Many of the U.S.
Read more: Countries with similar GDP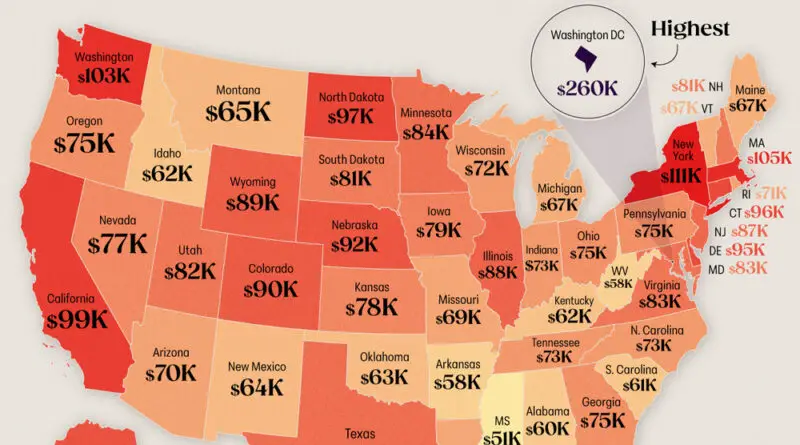
Journey through America’s economic landscape with comprehensive GDP analysis. From the Southeast’s diverse economy to California’s tech dominance, uncover the forces shaping our nation’s prosperity state by state.
Read more: The Economic Map of America: Understanding U.S. GDP State by StateSome of the comparatively more developed European nations are also relatively more corrupt. For example, although, Switzerland and Norway are
Read more: Corruption is Widespread Across EuropeTop 20 the industries with the United States with the largest employment. Elementary and secondary schools Local government (excluding education
Read more: Largest % of Jobs by Industry Type by [Census Tract] 2013 ACS 5 YearThe roads and routes constructed and developed by the Roman bound all manner of peoples together, made possible the intermingling
Read more: Trade Routes of the Roman Empire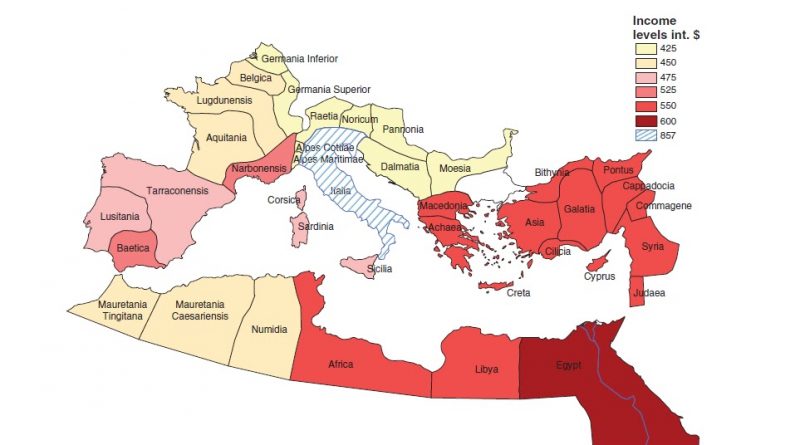
Economic historians differ in their estimates of the gross domestic product of the Roman economy. Per capita income in the provinces of the Roman Empire range from $425 to $867 (2000 US dollar). The GDP per capita of Italy is valued at approximately 50 percent higher than in the rest of the Roman Empire.
Read more: Per capita income in the provinces of the Roman EmpireMap showing the U.S. cities with the most jobs accessible within 30 minutes of walking or public transit.
Read more: Top 10 Most Job Accessible Cities in the USThe uneven spatial distribution of economic activity in the United States is a complex interplay of historical legacies, policy decisions, and global economic trends. Addressing these disparities requires multifaceted approaches, including targeted investments in infrastructure, education, and workforce development to foster more inclusive and sustainable economic growth across the nation.
Read more: U.S. economic activity, split in halfWomen and youth hit hardest by unemployment. Nearly half of all the world’s youth (621 million) are not employed, in
Read more: The unemployment rate in % of the populationRepresents the hourly wage that a household must earn (working 40 hours a week, 52 weeks a year) in order
Read more: 2015 Two-bedroom rental unit housing wageThe EU is the 2nd largest economy in the planet. The EU’s Gross Domestic Product was determined to be $18.8 trillion in 2018, representing 22 percent of the world economy.
Read more: Gross domestic product per inhabitant in the EUWhen compiling the rating of countries, the following indicators were used: starting a business, dealing with construction permits, getting electricity, registering property, getting credit, protecting minority investors, paying taxes, trading across borders, enforcing contracts, and resolving insolvency.
Read more: Most Business-Friendly Countries