On average, the point nearest to everyone on our planet is in the north of South Asia, with a mean distance of 5 thousand kilometers or 3 thousand miles. Its antipodal point is contrarily the most distant point from everyone globally is located in the South Pacific, not so far from Easter Island, with a mean distance of 15 thousand kilometers or 9.3 thousand miles.
Centre of the population for every nation in the world
The map below shows the center of population for each nation globally, the same number of people east and west and north and south of the point. The map was created using gridded population data of the Socioeconomic Data and Applications Center.
@nailrkaye
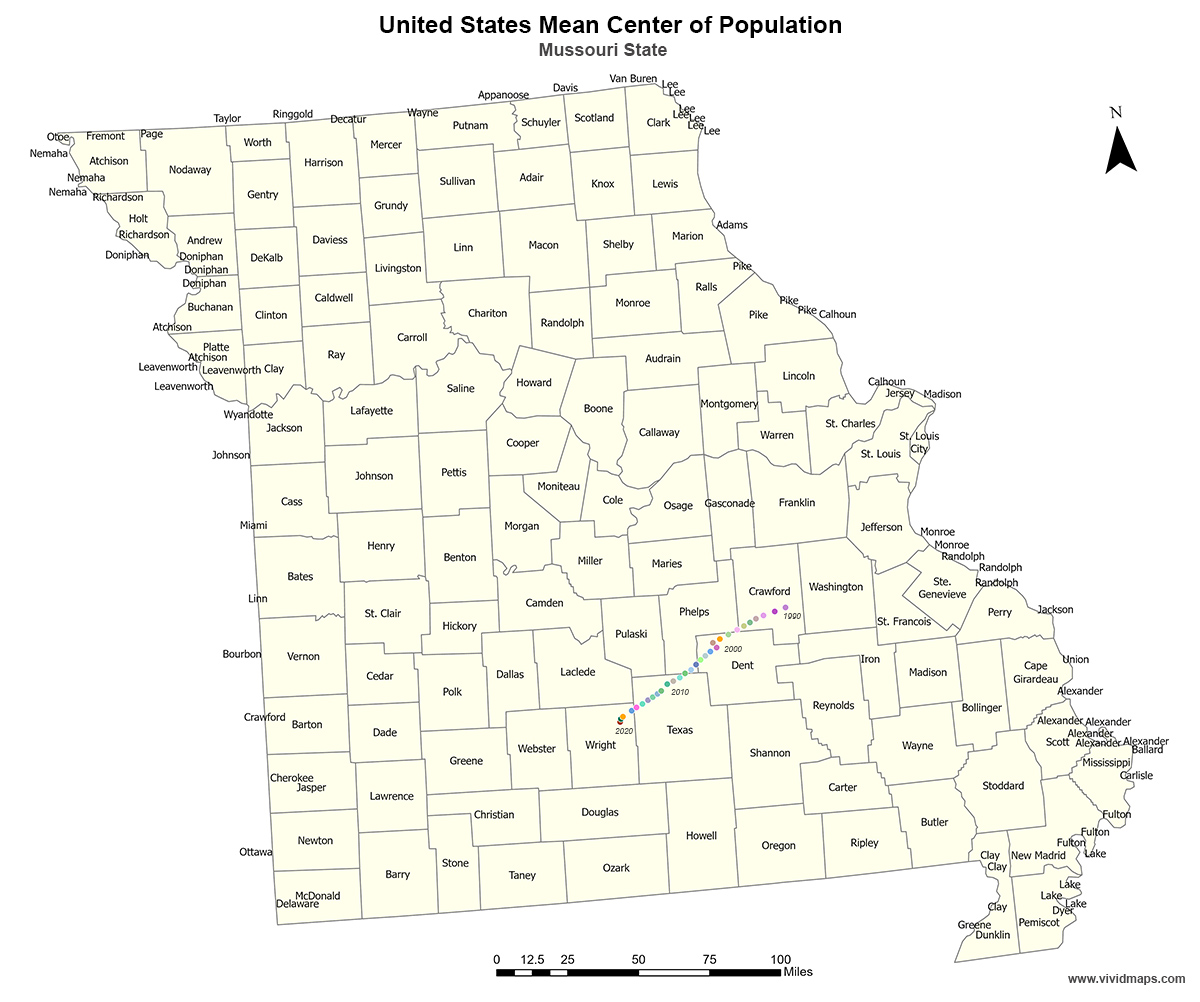
Center of the population of the United States
The center of the U.S. population is located in Wright county. The map below shows changes to the mean center of population for the United States from 1990 to 2020.
But the population center of each country is not constant. For example, in the United States аfter moving 966 kilometers (600 miles) west by south throughout the 19th century, the change in the population’s mean center during the 20th century was less noticeable, moving 521 kilometers 324 miles west and 163 kilometers (101 miles) south. Almost 79 percent of the overall southerly shift occurred between 1950 and 2000.
The map below shows the shifting of the mean center of the United States population from 1790 to 2010.