Climate classification systems
Climate classification systems are methods of dividing the world’s climates. A climate classification may associate with a biome class, as the climate is a major impact on living organisms in an area.
The climate depends on many factors: latitude, long-term atmospheric and ocean circulation patterns, elevation, closeness to large water bodies and mountains, etc.
Jointly, these factors influence the range of temperatures and the quantity of rain or snow each area obtains through the year and, accordingly, the spatial arrangement of biomes.
Below you can find different examples of climate classification systems.
Table of Contents
Köppen-Geiger climate classification
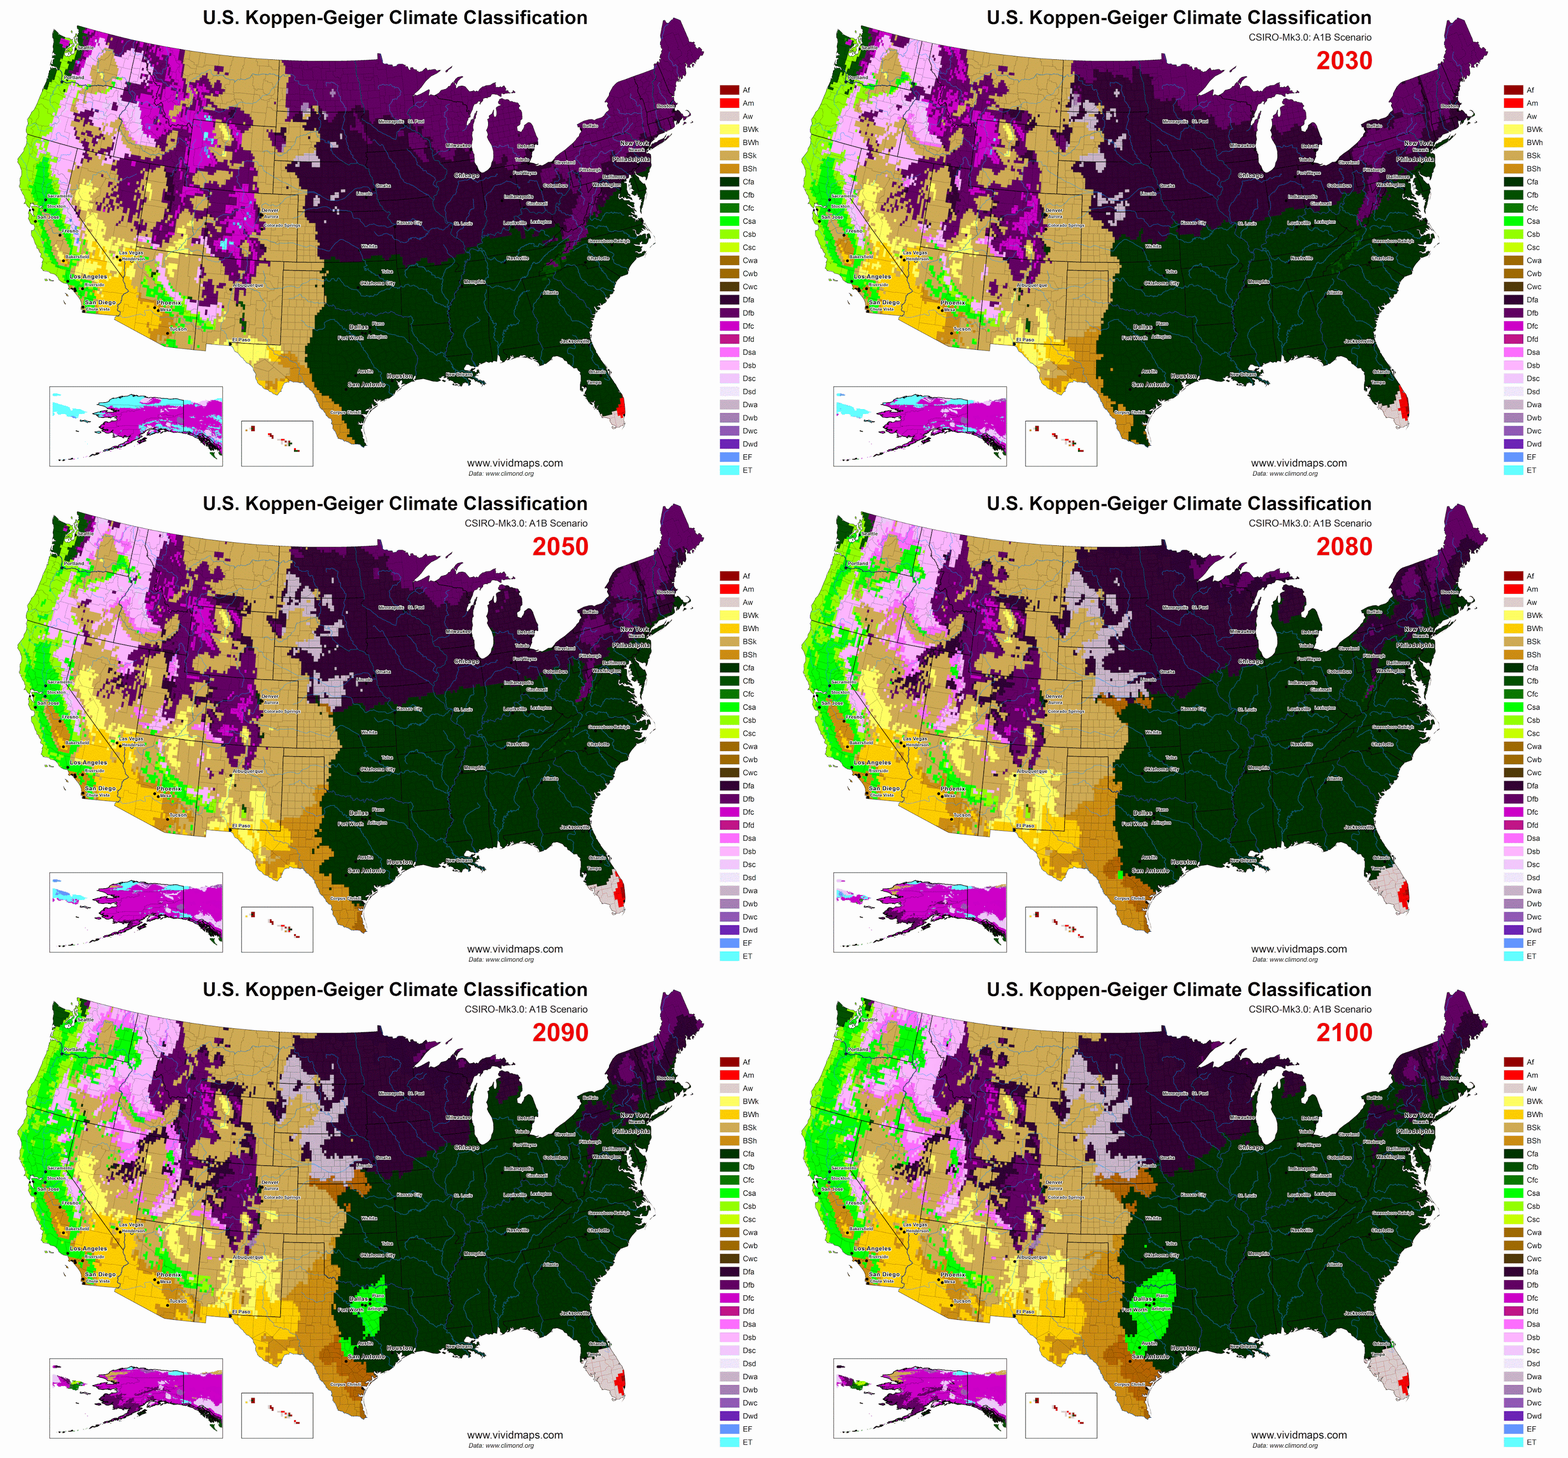
Köppen climate classification is the most popular classification scheme. It was first announced by the German-Russian climatologist Wladimir Köppen. The Köppen climate classification scheme classifies climates into 5 main climate groups (A – tropical, B – dry, C – temperate, D – continental, E – polar), with each group being split based on seasonal precipitation (f – rainforest, m – monsoon, w – wet summer, s – dry summer, W – desert, S – steppe, f – without dry season) and temperature patterns (h – hot, k – cold, a – hot summer, b – warm summer, c – cold summer, d – very cold winter).

Trewartha climate classification
The Trewartha climate classification scheme is an altered version of the Köppen-Geiger system. It was first announced by American geographer Glenn Thomas Trewartha. The Trewartha system classification scheme reconsiders the middle latitudes closer to vegetation zoning and genetic climate systems.
Glenn Thomas Trewartha reclass the middle latitudes into 3 groups: C (subtropical) – 8 or more months have a mean temperature of 10 °C (50 °F) or higher; D temperate – 4 to 7 months have a mean temperature of 10 °C or higher; and E boreal climate – 1 to 3 months have a mean temperature of 10 °C or higher. The tropical climates and polar climates persisted the same as the original Köppen climate classification.

Alisov climate classification
The Alisov climate classification scheme classifies climates into 7 major climatic belts – equatorial, subequatorial, tropical, subtropical, mid-latitude subarctic/subantarctic, and arctic/antarctic.
The climatic bands subdivide longitudinally. For example, the western part of a temperate band on a continent is classified as “temperate oceanic.” Immediately to the east of it is a “mild-continental climate” followed by “actively continental” and then “temperate monsoon.” The subtropical zone reflects a similar pattern, the Mediterranean climate in the west to a monsoon climate on the eastern side of continents.

Climate classification by Wincenty Okołowicz
Wincenty Okołowicz is a polish geographer. He splits the Polar zone into 2 groups: Polar (Greenland) and Subpolar (Alaska); Temperate zone into 6 groups: Temperate cool continental (Edmonton) – temperate cool transitional (Saint-Petersburg) – temperate cool oceanic (Iceland),
Temperate warm continental (Illinois) – temperate warm transitional (Warsaw) – temperate warm oceanic (Irland); Subtropical zone into 2 groups: Subtropical dry (Iraq) and Subtropical wet (Greece); Tropical zone into 2 groups: Tropical dry (Sudan) and Tropical wet (Florida); Equatorial zone into 3 groups: Subequatorial dry (Chad), Subequatorial wet (Kongo) and Equatorial extremely wet (Singapore).

The Global environmental stratification
The Global environmental stratification (GEnS) is based on statistical clustering of bioclimate data (WorldClim). GEnS consists of 125 strata, which have been aggregated into 7 broad biomes (Arctic, Boreal, Cool temperate, Warm temperate, Sub-tropical, Drylands, Tropical) and 18 global environmental zones.

It is a very convenient climate classification system for various scientific studies to study the spatial distribution patterns of various objects. Previously I tries to use GEnS for comparing the climate in different cities.
Other types of climatic maps
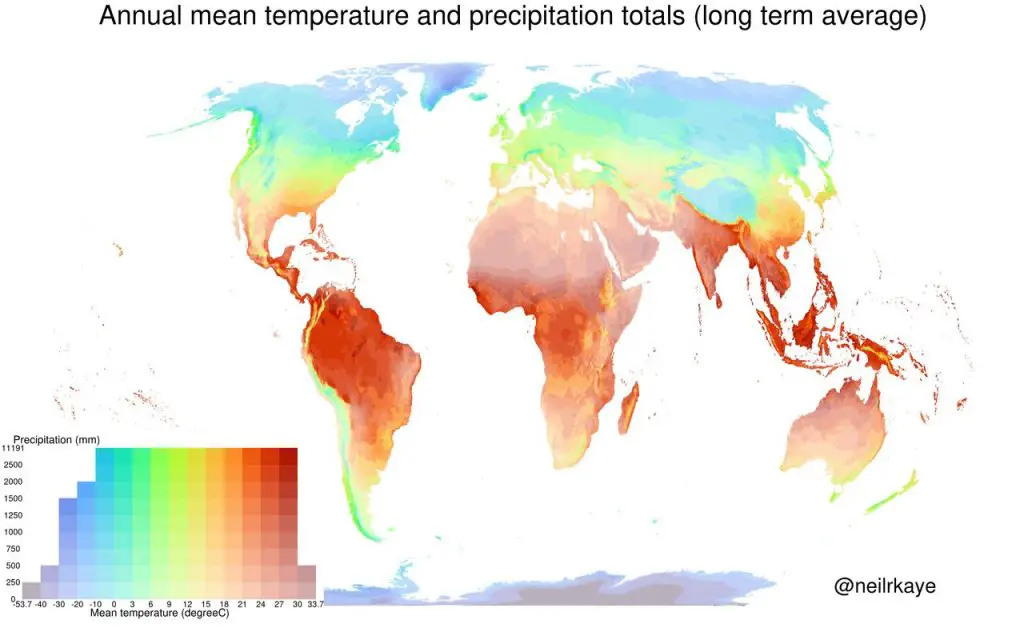
Anyone can try to develop their climate classification system. As an example, below is an exciting attempt to visualize the climatic differences between different regions of the Earth made by Reddit user Neilrkaye. He visualized temperature and precipitation on the same map. The color shows the temperature, and the more saturated the color is, the more precipitation there is.
