Distribution of wealth in Europe
Wealth is the entire sum value of monetary assets and valuable material possessions held by an individual, minus personal debt.
According to Credit Suisse, wealth creation in 2020 was mainly resistant to the challenges facing humanity due to the efforts taken by governments and central banks to reduce the economic consequence of the COVID pandemic.
Total global wealth rose by 7.4 percent, and wealth per adult grew by 6 percent to reach another record high of 79,952$US.
2020 records the year when, for the first time, over 1 percent of all global adults are dollar millionaires. The global number of millionaires increased by 5.2 million to touch 56.1 million.
North America and Europe jointly account for 57% of total household wealth but have only 17% of the world’s adult population.
In Europe, the overall average wealth per adult as of 2020 was $91.900. Europe had the second-highest value globally, after North America, in terms of private wealth.
Table of Contents
European country rankings by mean and median wealth per adult
Country rankings by mean wealth per adult (2020)
| Rank | Country | Mean wealth per adult in 2020, $ |
|---|---|---|
| 1 | Switzerland | 673,960 |
| 2 | Luxembourg | 407,306 |
| 3 | Netherlands | 377,090 |
| 4 | Denmark | 376,070 |
| 5 | Belgium | 351,330 |
| 6 | Iceland | 337787 |
| 7 | Sweden | 336,166 |
| 8 | France | 295,355 |
| 9 | United Kingdom | 290,724 |
| 10 | Austria | 290,348 |

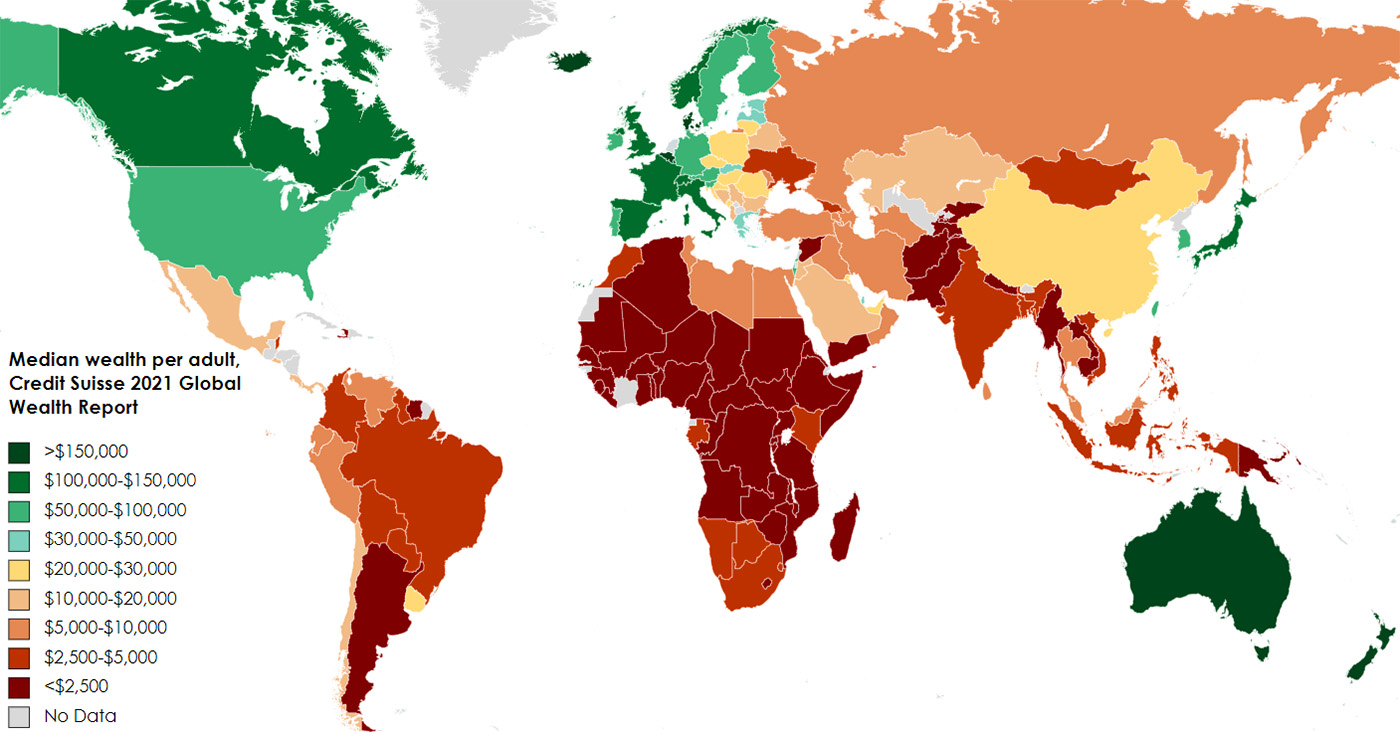
Country rankings by median wealth per adult (2020)
| Rank | Country | Median wealth per adult in 2020, $ |
|---|---|---|
| 1 | Luxembourg | 259,899 |
| 2 | Iceland | 231,426 |
| 3 | Belgium | 230,550 |
| 4 | Denmark | 165,622 |
| 5 | Switzerland | 146,730 |
| 6 | Netherlands | 136,110 |
| 7 | France | 133,560 |
| 8 | United Kingdom | 131,520 |
| 9 | Italy | 118,885 |
| 10 | Norway | 117,798 |
If we look at the world, only four countries (United States, Singapore, Canada, and New Zealand) can compete with European countries in terms of mean and median wealth per adult.
World country rankings by mean and median wealth per adult
Country rankings by mean wealth per adult (2020)
| Rank | Country | Mean wealth per adult in 2020, $ | Mean wealth per adult change 2019-2020, $ |
|---|---|---|---|
| 1 | Switzerland | 673,960 | +70,730 |
| 2 | United States | 505,420 | +41,870 |
| 3 | Hong Kong SAR | 503,340 | –26,420 |
| 4 | Australia | 483,760 | +65,700 |
| 5 | Netherlands | 377,090 | +46,030 |
| 6 | Denmark | 376,070 | +38,750 |
| 7 | Belgium | 351,330 | +54,030 |
| 8 | New Zealand | 348,200 | +15,150 |
| 9 | Sweden | 336,170 | +55,460 |
| 10 | Singapore | 332,990 | +25,460 |
Country rankings by median wealth per adult (2020)
| Rank | Country | Median wealth per adult in 2020, $ | Median wealth per adult change 2019-2020, $ |
|---|---|---|---|
| 1 | Australia | 238,070 | +32,280 |
| 2 | Belgium | 230,550 | +35,330 |
| 3 | Hong Kong SAR | 73,770 | –10,550 |
| 4 | New Zealand | 171,620 | +7,180 |
| 5 | Denmark | 165,620 | +16,980 |
| 6 | Switzerland | 146,730 | +14,090 |
| 7 | Netherlands | 136,110 | +16,880 |
| 8 | France | 133,560 | +7,090 |
| 9 | United Kingdom | 131,520 | +55,460 |
| 10 | Canada | 125,690 | +11,330 |
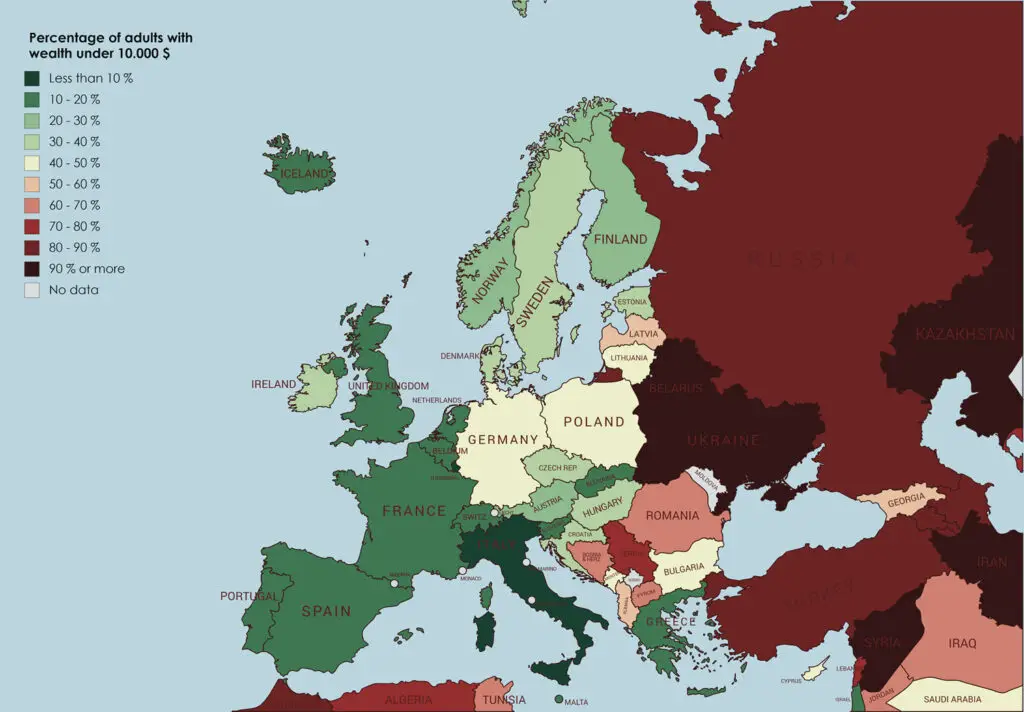
Credit Suisse team estimated that 2.9 billion individuals (55% of all adults worldwide) had wealth below 10,000$ in 2020. The successive strata, comprising those with wealth between 10,000–100,000$, had seen substantial growth in numbers this century, more than tripling in size from 507 million in 2000 to 1.7 billion in mid2020. This reveals the growing wealth of developing economies, especially China, and the enlargement of the middle class in the developing world. The average wealth of this group is 33,414$, slightly less than half the level of average wealth worldwide.
The map below shows the percentage of European adults with wealth under 10,000$US.
With wealth varying from 100,000 to 1 million US dollars, the upper-middle segment has grown remarkably from 208 million to 583 million. They nowadays hold net assets totaling 163.9 trillion US dollars or 39.1% of global wealth, which is almost four times their share of the adult population. The middle class in developed countries generally belongs to this strata.
Exceeding them, the top level of high net worth individuals stays relatively small in size but has ballooned in recent years. It currently numbers 56 million or 1.1% of all adult individuals. Adults now require over 1 million US dollars to qualify for the top 1% in the global distribution. The group now enfolds all global top 1% members plus approximately half a million US dollars. High net worth individuals are progressively dominant in total wealth ownership and their share of global wealth. The aggregate wealth of high net worth individuals has grown almost four-fold from 41.5 trillion in 2000 to 191.6 trillion in 2020 US dollars, and their share of global wealth has increased from 35% to 46% over the same period.
According to Credit Suisse, global wealth is expected to increase by 39% following 5 years, reaching 583 trillion by 2025. Low- and middle-income nations handle 42% of the growth, although they account for only 33% of current wealth. Wealth per adult is forecasted to rise by 31%, passing the watershed mark of 100,000 US dollars. The number of millionaires will also grow considerably over the following 5 years, touching 84 million, while the number of high net worth individuals should reach 344,000.

