District Mobility: Multimodal Transportation in the District
District Mobility is a tool to visualize multimodal transportation system performance within the District of Columbia as a part of the District Department of Transportation District Mobility Project.
The District’s 660,000 residents are joined by approximately 600,000 commuters and as many as 125,000 visitors entering the District every day. All of these people need to be able to move around the District to get between work and home, shop, socialize and access services. This activity can result in a congested transportation system for all types of travelers. Addressing congestion starts by first understanding who the transportation system is serving, the infrastructure we have to work with, and how people are choosing to get around.
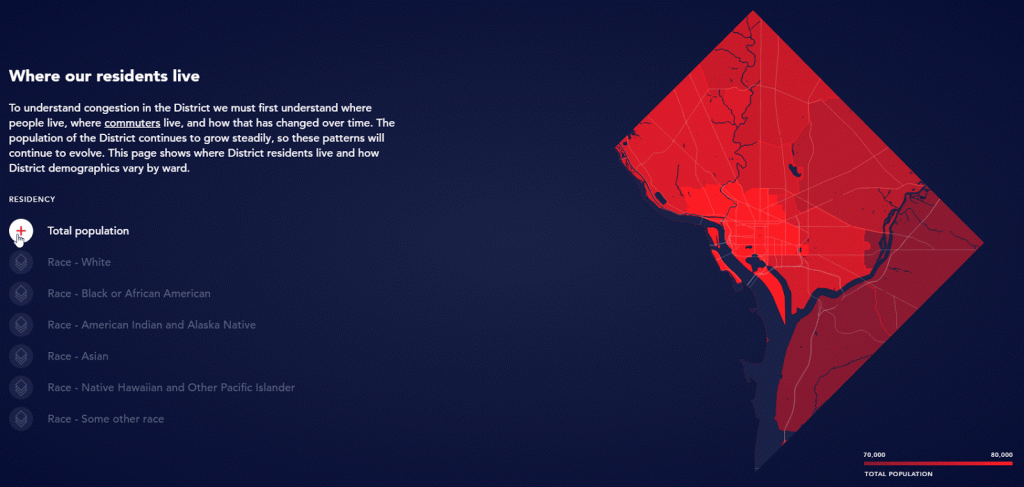
Where our residents live
To understand congestion in the District we must first understand where people live, where commuters live, and how that has changed over time. The population of the District continues to grow steadily so these patterns will continue to evolve. This page shows where District residents live and how District demographics vary by ward.
Source: districtmobility.org
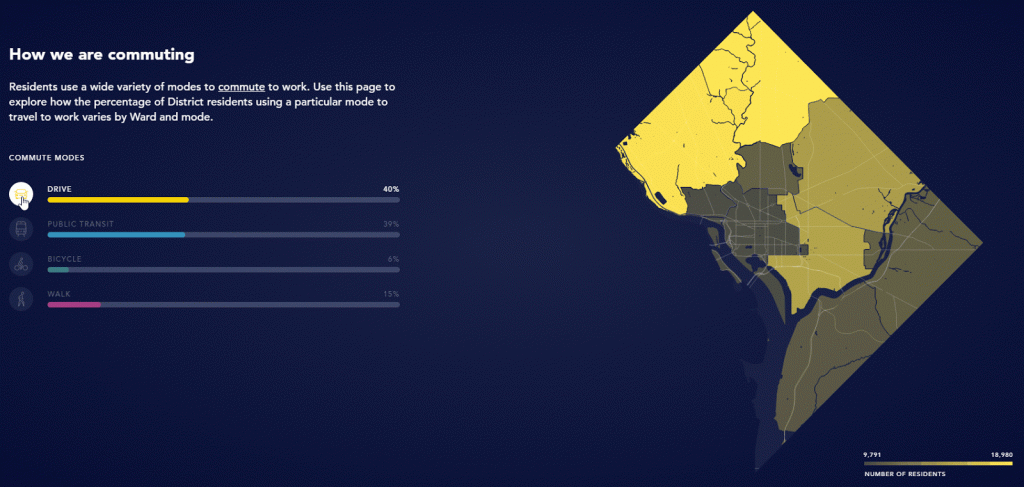
How we are commuting
Residents use a wide variety of modes to commute to work. Use this page to explore how the percentage of District residents using a particular mode to travel to work varies by Ward and mode.
Source: districtmobility.org
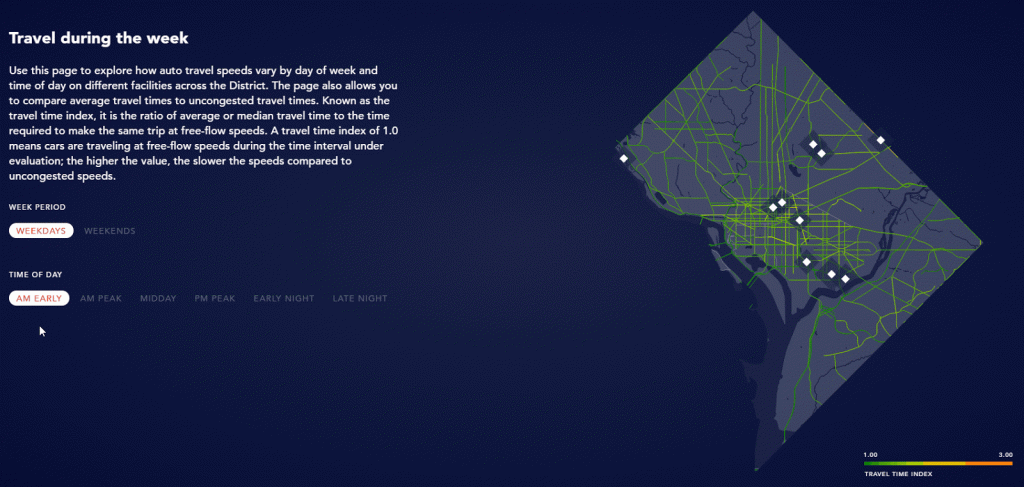
Travel during the week
Use this page to explore how auto travel speeds vary by day of week and time of day on different facilities across the District. The page also allows you to compare average travel times to uncongested travel times. Known as the travel time index, it is the ratio of average or median travel time to the time required to make the same trip at free-flow speeds. A travel time index of 1.0 means cars are traveling at free-flow speeds during the time interval under evaluation; the higher the value, the slower the speeds compared to uncongested speeds.
Source: districtmobility.org
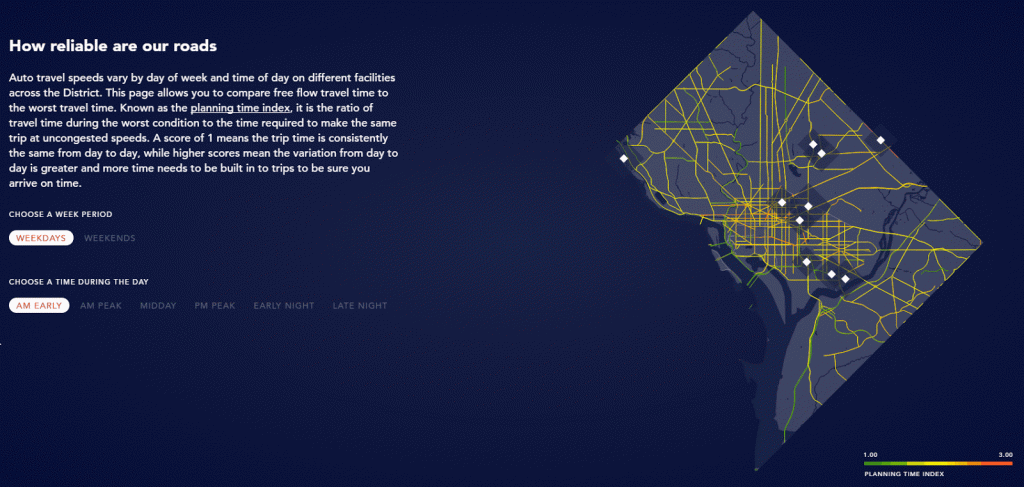
How reliable are our roads
Auto travel speeds vary by day of week and time of day on different facilities across the District. This page allows you to compare free flow travel time to the worst travel time. Known as the planning time index, it is the ratio of travel time during the worst condition to the time required to make the same trip at uncongested speeds. A score of 1 means the trip time is consistently the same from day to day, while higher scores mean the variation from day to day is greater and more time needs to be built in to trips to be sure you arrive on time.
Source: districtmobility.org
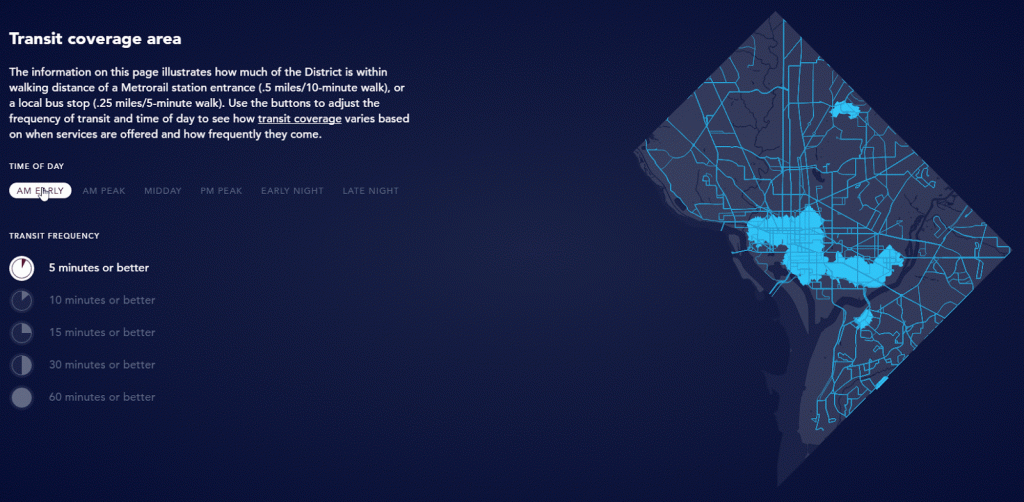
Transit coverage area
The information on this page illustrates how much of the District is within walking distance of a Metrorail station entrance (5 miles/10-minute walks), or a local bus stop (.25 miles/5-minute walk). Use the buttons to adjust the frequency of transit and time of day to see how transit coverage varies based on when services are offered and how frequently they come.
Source: districtmobility.org
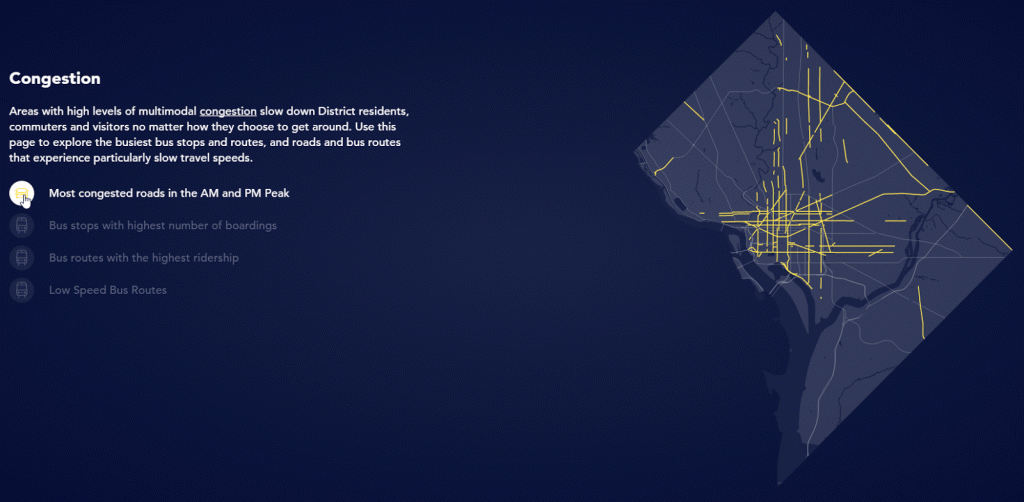
Congestion
Areas with high levels of multimodal congestion slow down District residents, commuters and visitors no matter how they choose to get around. Use this page to explore the busiest bus stops and routes, and roads and bus routes that experience particularly slow travel speeds.
Source: districtmobility.org

