An Earthquake is shaking the Earth’s surface by energy waves emitted by drifting tectonic plates overcoming clash with one another underneath the Earth’s surface.
Since 1900, earthquakes have taken place in 39 American States. The three U.S. states with the highest earthquake risk in the United States are Alaska, California, and Hawaii.
Alaska 75% of all earthquakes in the U.S. with magnitudes larger than 5 happen in Alaska.
Most powerful earthquakes in Alaska are provoked by the subduction of the Pacific plate beneath Alaska. It occurs as the Pacific plate moves under the North American plate between 5-7 centimeters (2.0-2.8 inches) per year.
California earthquakes are driven by vast blocks of the Earth’s crust moving, the Pacific and North American plates.
Hawaii According to scientists, there is a 90% chance that people in Hawaii and Maui could experience destructive earthquakes during the following 100 years.
Eruptive processes within active volcanoes or by deep structural alterations force earthquakes in Hawaii.
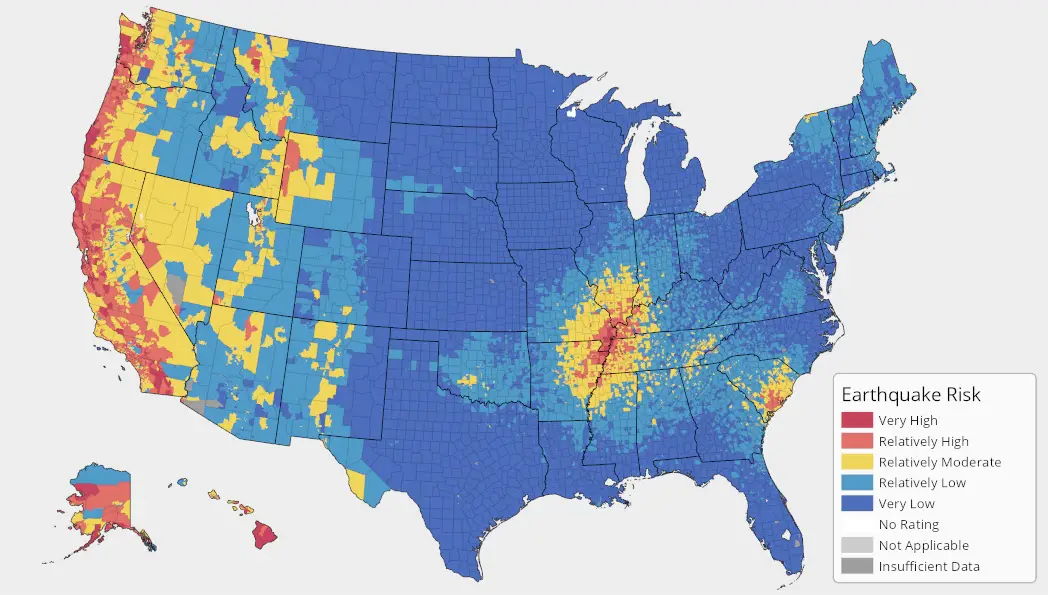
Below is the Earthquake Risk Index map, representing a community’s relative risk for earthquakes compared to the rest of the U.S.
One hundred eighty-five earthquakes with magnitudes from 4.9 to 9.2 were recorded in the United States from June 11, 1985, to December 20, 2022.
Top 10 Most Powerful Earthquakes in the United States by Magnitude
Top 10 Most Powerful Earthquakes in the United States by Magnitude
Rank
Earthquake
State
Magnitude
Fatalities
1
1906 San Francisco earthquake
California
7.9
3000+
2
1811–1812 New Madrid earthquakes
Missouri
7.5–8.0 M
250
3
1946 Aleutian Islands earthquake and tsunami
Alaska
8.6
165
4
1964 Alaska earthquake and tsunami
Alaska
9.2
143
5
1933 Long Beach earthquake
California
6.4
120
6
1868 Hawaii earthquake and tsunami
Hawaii
7.9
77
7
1989 Loma Prieta earthquake
California
6.9
63
8
1886 Charleston earthquake
South Carolina
6.9–7.3
60
9
1971 San Fernando earthquake
California
6.5–6.7
60
10
1994 Northridge earthquake
California
6.7
57
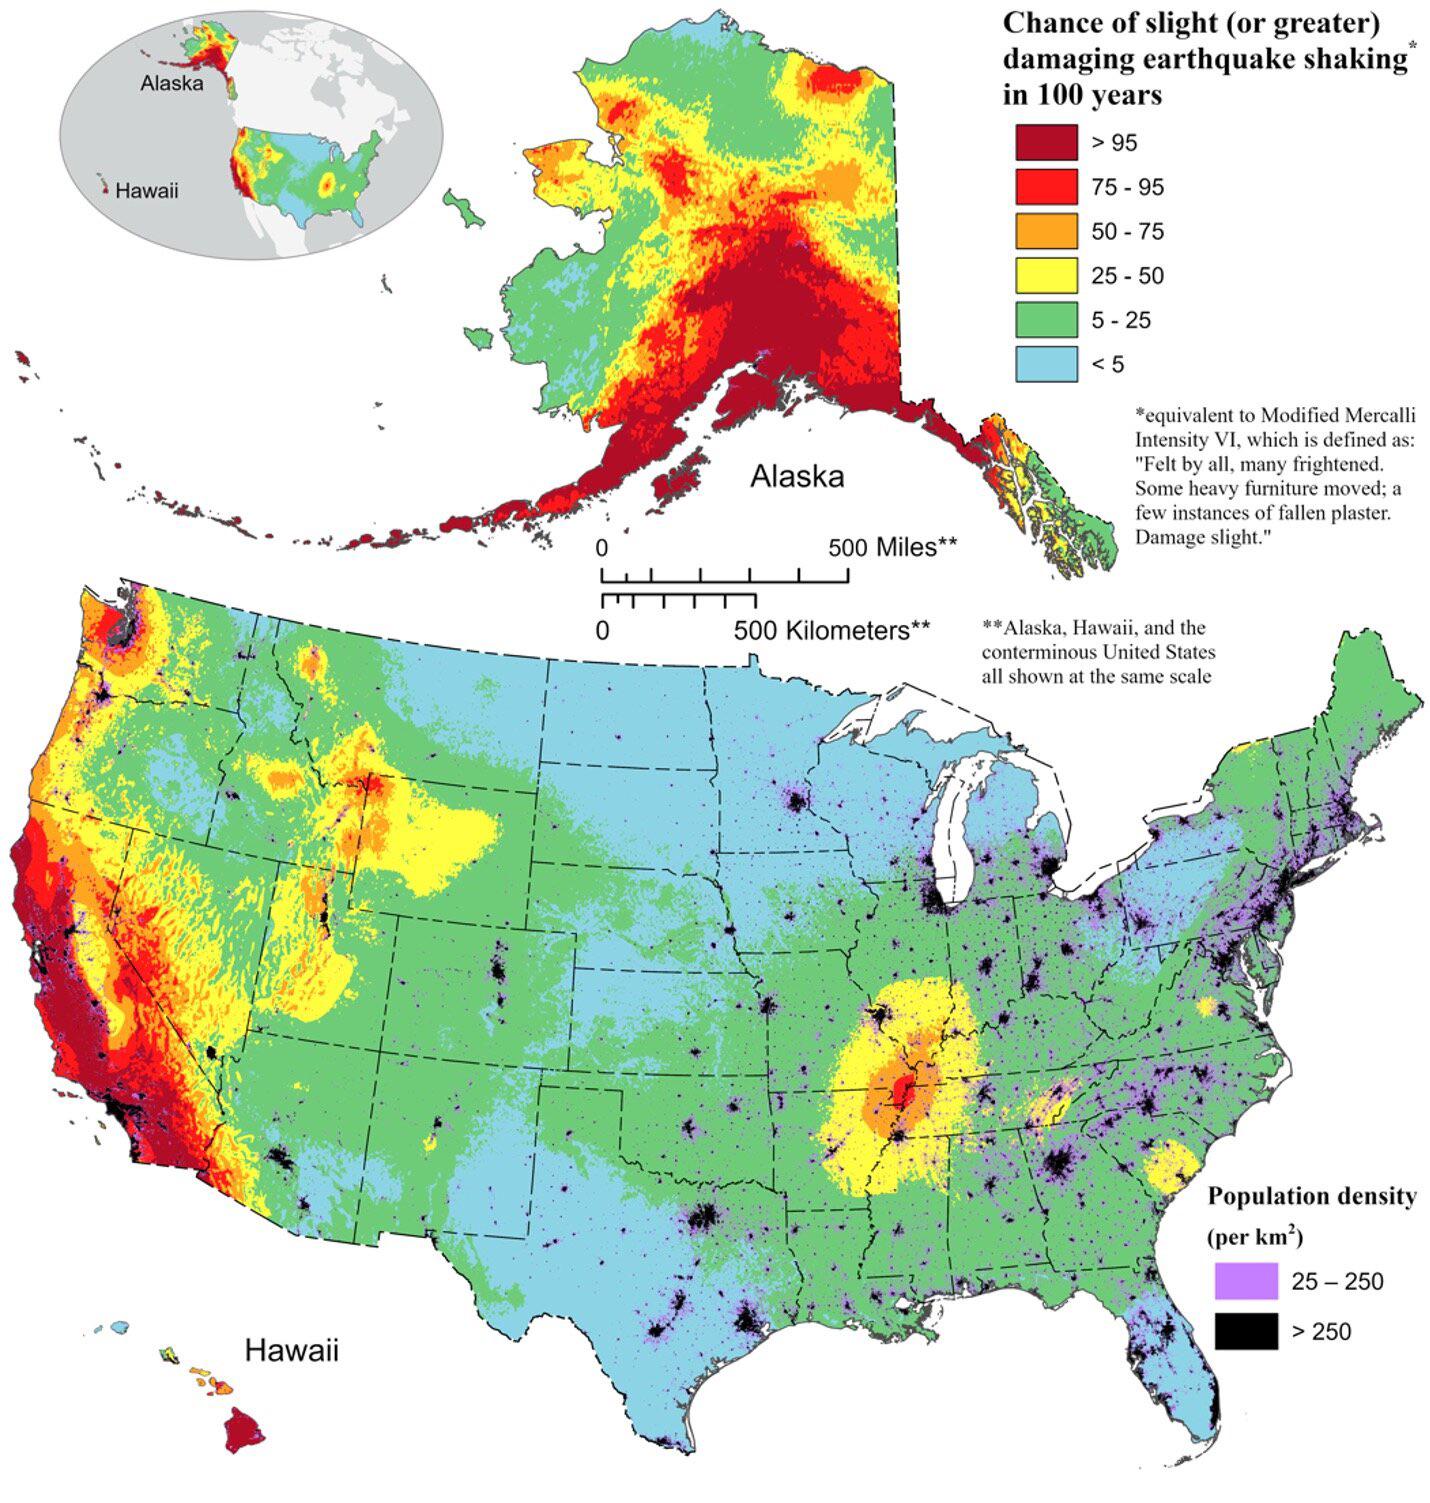
The map below created by U.S. Geological Survey shows chances of damaging earthquakes in the United States over the next century.
This map clearly shows high seismic activity is anticipated on the West Coast, particularly in California, due to major fault lines like the San Andreas Fault. Alaska, situated along the Pacific Ring of Fire, is prone to frequent earthquakes. The Intermountain West, encompassing states like Nevada and Utah, also faces seismic risks. The central U.S., though having lower activity compared to the West Coast, has potential earthquake hazards, notably in the New Madrid Seismic Zone. The East Coast generally experiences lower seismic activity, but the USGS continually monitors and assesses earthquake hazards in this region.
You might be familiar with Pangea, a prehistoric supercontinent formed when all of Earth’s significant landmasses merged about 300 million years ago.
Before Pangea, there was the supercontinent Rodinia, which assembled itself between 950 million and 1.3 billion years ago. Then around 750 million years ago, Rodinia started to break apart. Rifts (or faults) emerged between — and within — the various continental plates. Some 600 million years ago, a point of division called the Reelfoot Rift appeared in what’s now the southeastern United States.
On occasion, rifts split continents in half. That didn’t happen here: The Reelfoot Rift was stopped in its tracks. Geologically speaking, it failed — but not before it weakened part of the continental plate and created faults that still exist today.
“[It] left something of a scar in the otherwise old and relatively homogeneous crust,” Susan Hough, a seismologist with the U.S. Geological Survey, says via email. The New Madrid Seismic Zone lies within the Reelfoot Rift. To earthquake researchers like Hough, this region is an enigma. As her email notes, there are a lot of other failed mid-continent rifts in North America. (A massive one extends beneath Lake Superior.) Yet these “have not produced significant earthquakes in recent or historic times.”
“So why has the Reelfoot lit up with earthquakes but not the [others]?” asks Hough. “There are some ideas but no definitive answer.”


What explains earthquakes along the Mississippi River basin?
You might be familiar with Pangea, a prehistoric supercontinent formed when all of Earth’s significant landmasses merged about 300 million years ago.
Before Pangea, there was the supercontinent Rodinia, which assembled itself between 950 million and 1.3 billion years ago. Then around 750 million years ago, Rodinia started to break apart. Rifts (or faults) emerged between — and within — the various continental plates. Some 600 million years ago, a point of division called the Reelfoot Rift appeared in what’s now the southeastern United States.
On occasion, rifts split continents in half. That didn’t happen here: The Reelfoot Rift was stopped in its tracks. Geologically speaking, it failed — but not before it weakened part of the continental plate and created faults that still exist today.
“[It] left something of a scar in the otherwise old and relatively homogeneous crust,” Susan Hough, a seismologist with the U.S. Geological Survey, says via email. The New Madrid Seismic Zone lies within the Reelfoot Rift. To earthquake researchers like Hough, this region is an enigma. As her email notes, there are a lot of other failed mid-continent rifts in North America. (A massive one extends beneath Lake Superior.) Yet these “have not produced significant earthquakes in recent or historic times.”
“So why has the Reelfoot lit up with earthquakes but not the [others]?” asks Hough. “There are some ideas but no definitive answer.”
https://science.howstuffworks.com/environmental/earth/geology/earthquakes-on-mississippi-new-madrid-seismic-zone.htm