The Electoral College is the group of presidential electors needed by the U.S. Constitution to form every 4 years for the single goal of electing the 2 highest leadership positions in the U.S. – the president and vice president.
The electors’ group comprises 538 members, which means a candidate needs at least 270 votes to win.
These members are sourced from every of the fifty U.S. states, and the amount of electors from a state is defined by the number of members it has in both the House of Representatives and Senate. Nowadays, the 2 houses have 535 members, with 435 coming from the House of Representatives and 100 from the Senate. The extra 3 come from D.C., as specified by the 23 Amendment.
California has the most electoral seats (55) of any U.S. state, while Texas places 2nd with 38 seats. New York and Florida each have 29 seats, while Pennsylvania and Illinois have 20 seats per state. Seven U.S. states (Alaska, Delaware, Montana, Vermont, Wyoming, North, and South Dakota) and D.C. have the least number of seats.
As a result, to win an election, candidates must appeal to a large and various set of states rather than concentrating only on the several U.S. cities with the most significant population densities.
The downside of this system is that residents living in the 8 least populous states, with 4.5 percent of the Electoral College, have more voting influence than people in the more populated U.S. states with 95.5 percent.
For example, in 2020, a state is awarded one electoral vote for every 615,242 people on average. However, Wyoming has 3 electoral votes and only 575,760 citizens (as of 2020 estimates). As a result, each of Wyoming’s 3 electoral votes corresponds to 191,920 people, and Wyomingites have 3 times as much clout in the Electoral College as an average American.
The map below shows contribution of each popular vote to electoral vote outcome, in number of persons, by U.S state
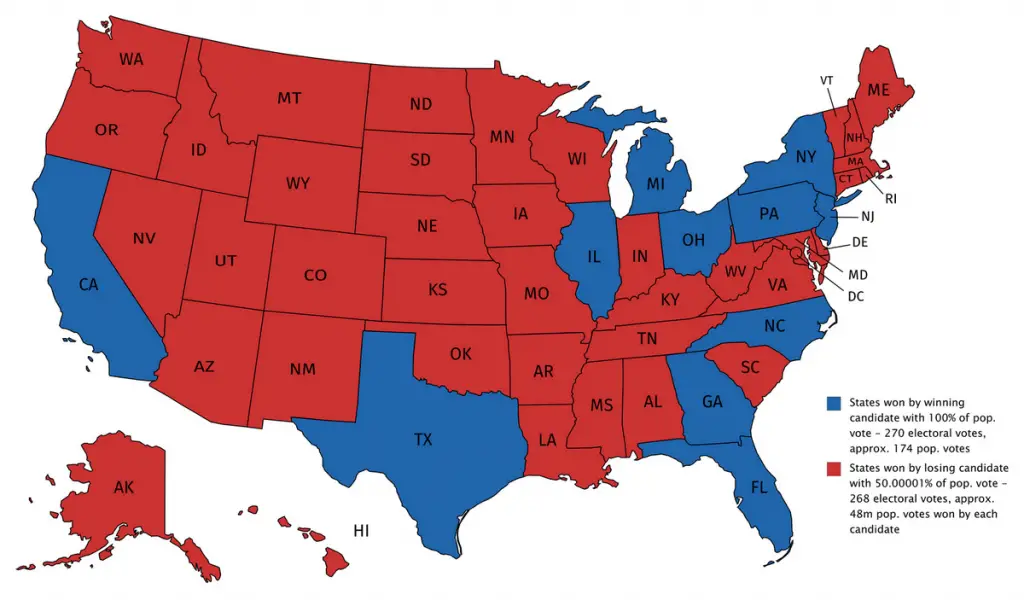
This electoral map of the U.S. below depicting the hypothetical scenario in which a candidate narrowly wins the election, notwithstanding having 126 million more popular votes.