Gross Domestic Product (GDP) per capita is a vital economic metric that provides insights into the standard of living and overall economic well-being of a country’s residents. It represents the average income earned by each individual in a nation when the total economic output is divided by the population.
GDP per capita is not just an economic statistic; it reflects broader social and quality-of-life aspects. Higher GDP per capita often correlates with better access to healthcare, education, infrastructure, and a higher standard of living. However, it doesn’t account for income inequality within a country, so a high GDP per capita doesn’t necessarily mean everyone in the country enjoys a high income.
Comparing GDP per capita between countries can be particularly informative. It helps identify disparities in wealth and development, showcasing the contrast between affluent and less affluent nations. When used in conjunction with other metrics, such as the Human Development Index (HDI), it provides a more comprehensive view of a country’s overall well-being, including education, health, and income.
Furthermore, GDP per capita can be influenced by various factors, including economic policies, resource endowments, political stability, and technological advancement. It is often used as a basis for making international economic and development comparisons, as well as setting priorities for governments and international organizations to address economic disparities and promote sustainable growth.
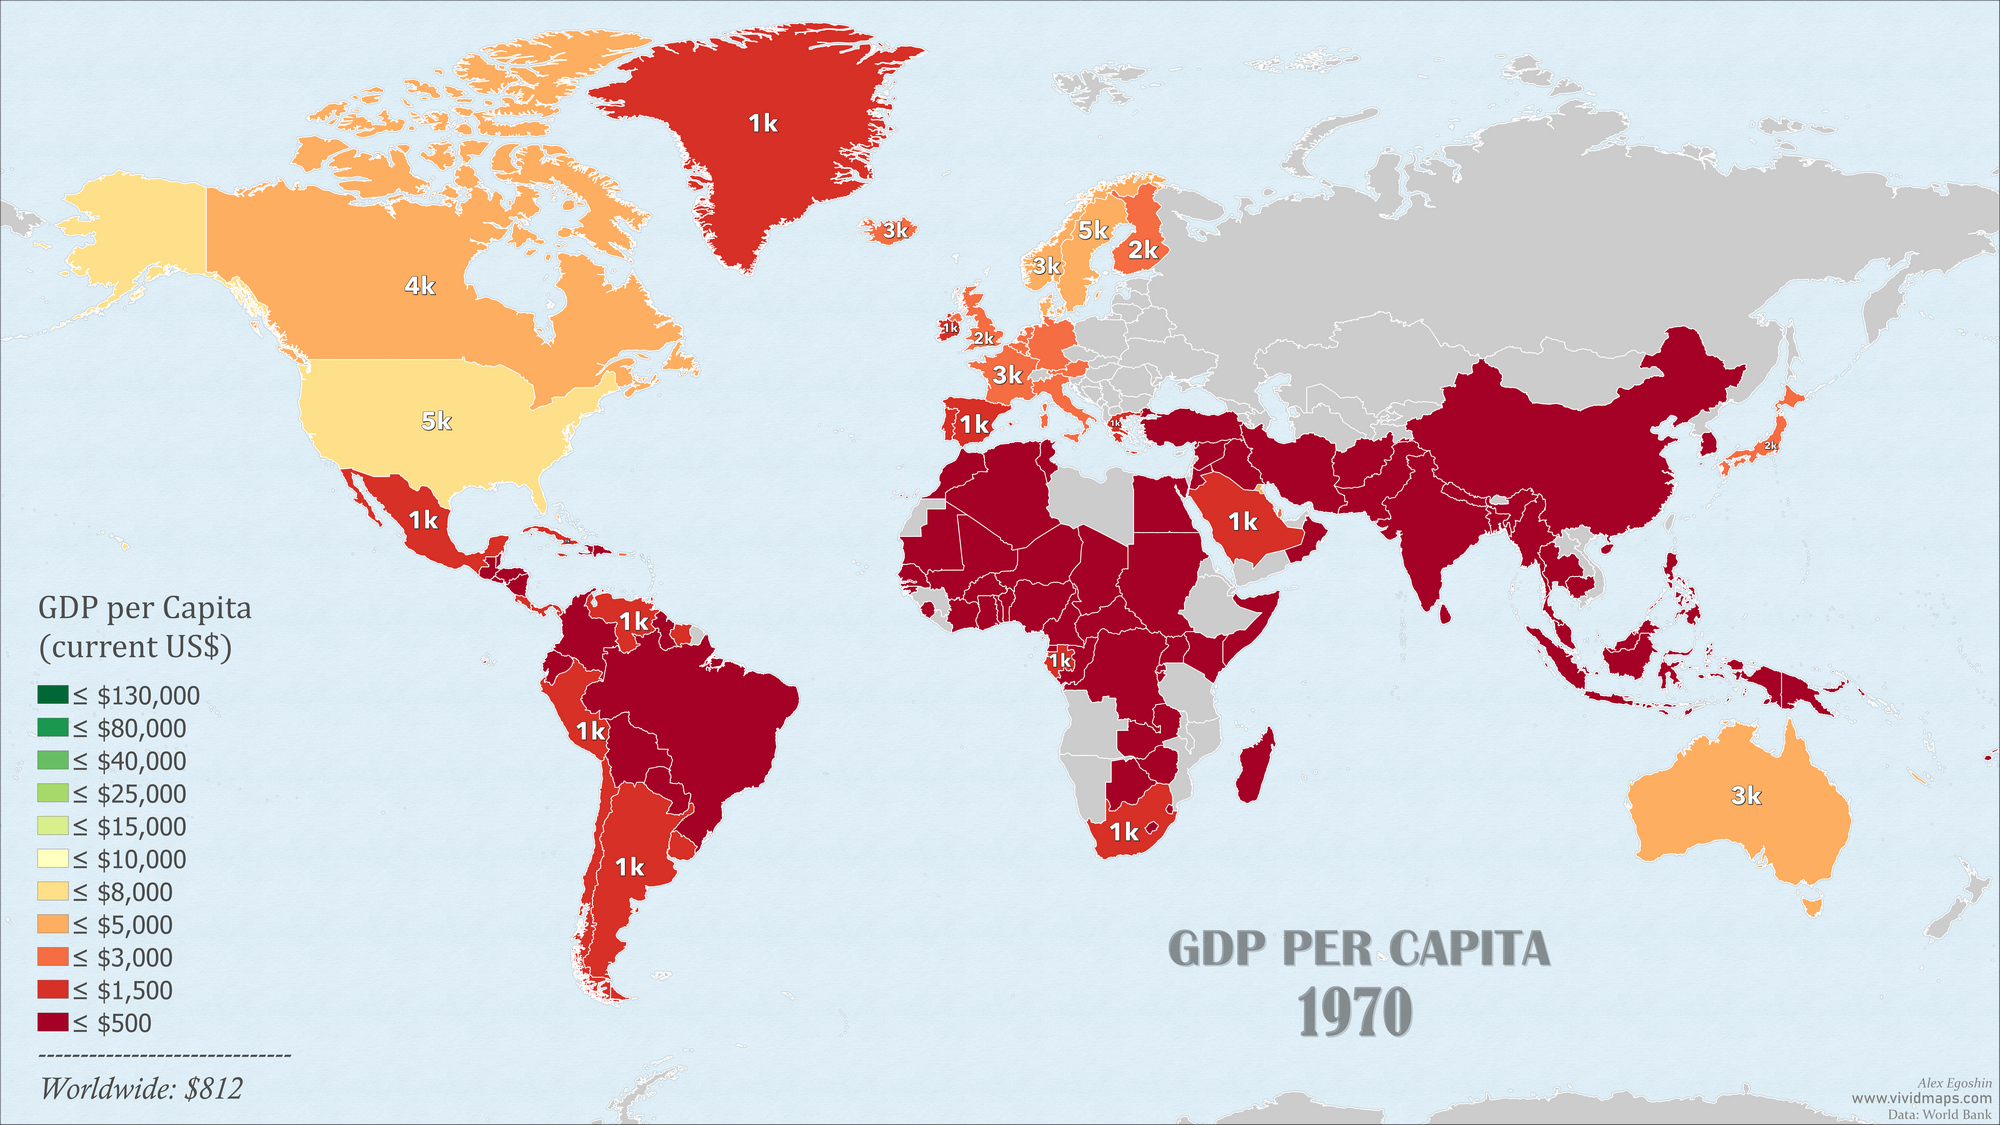
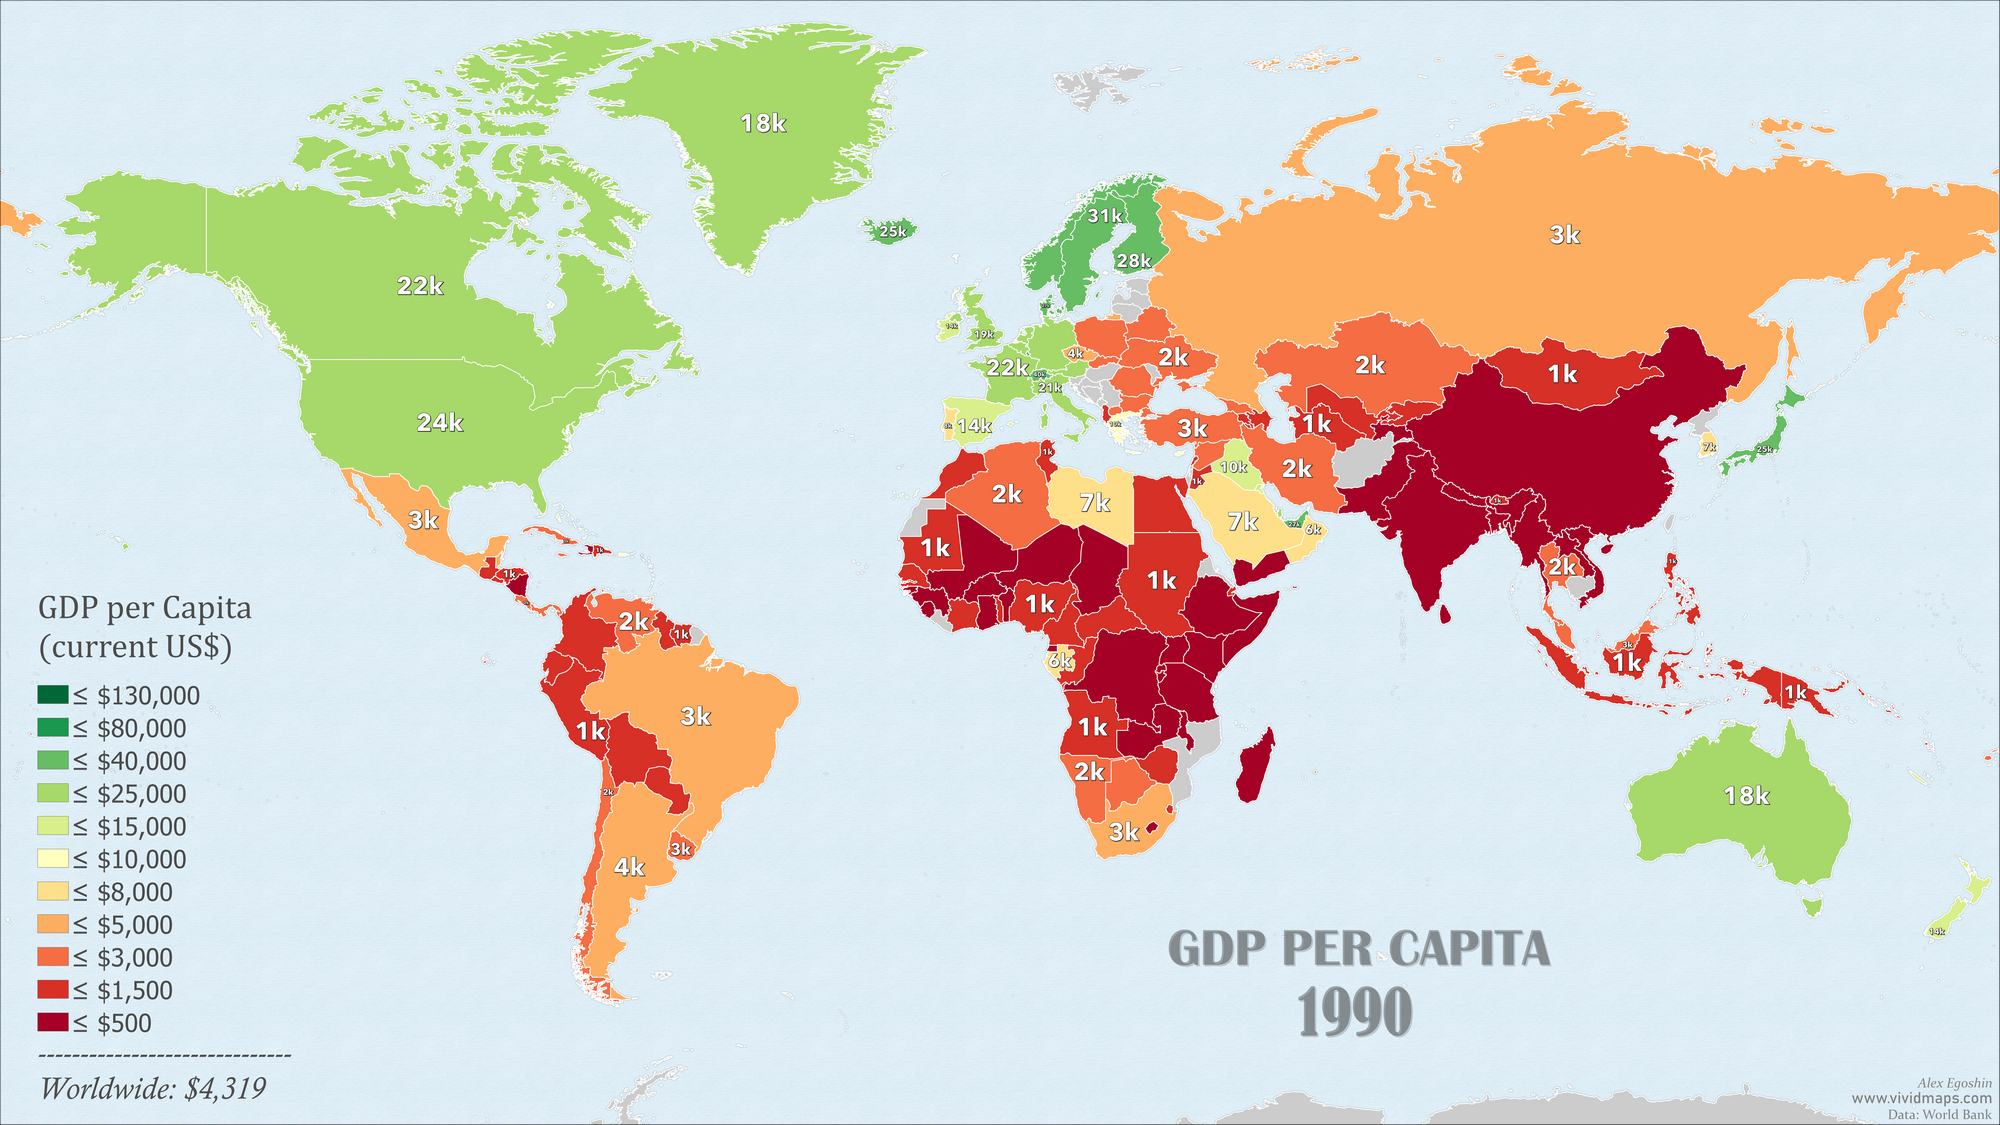
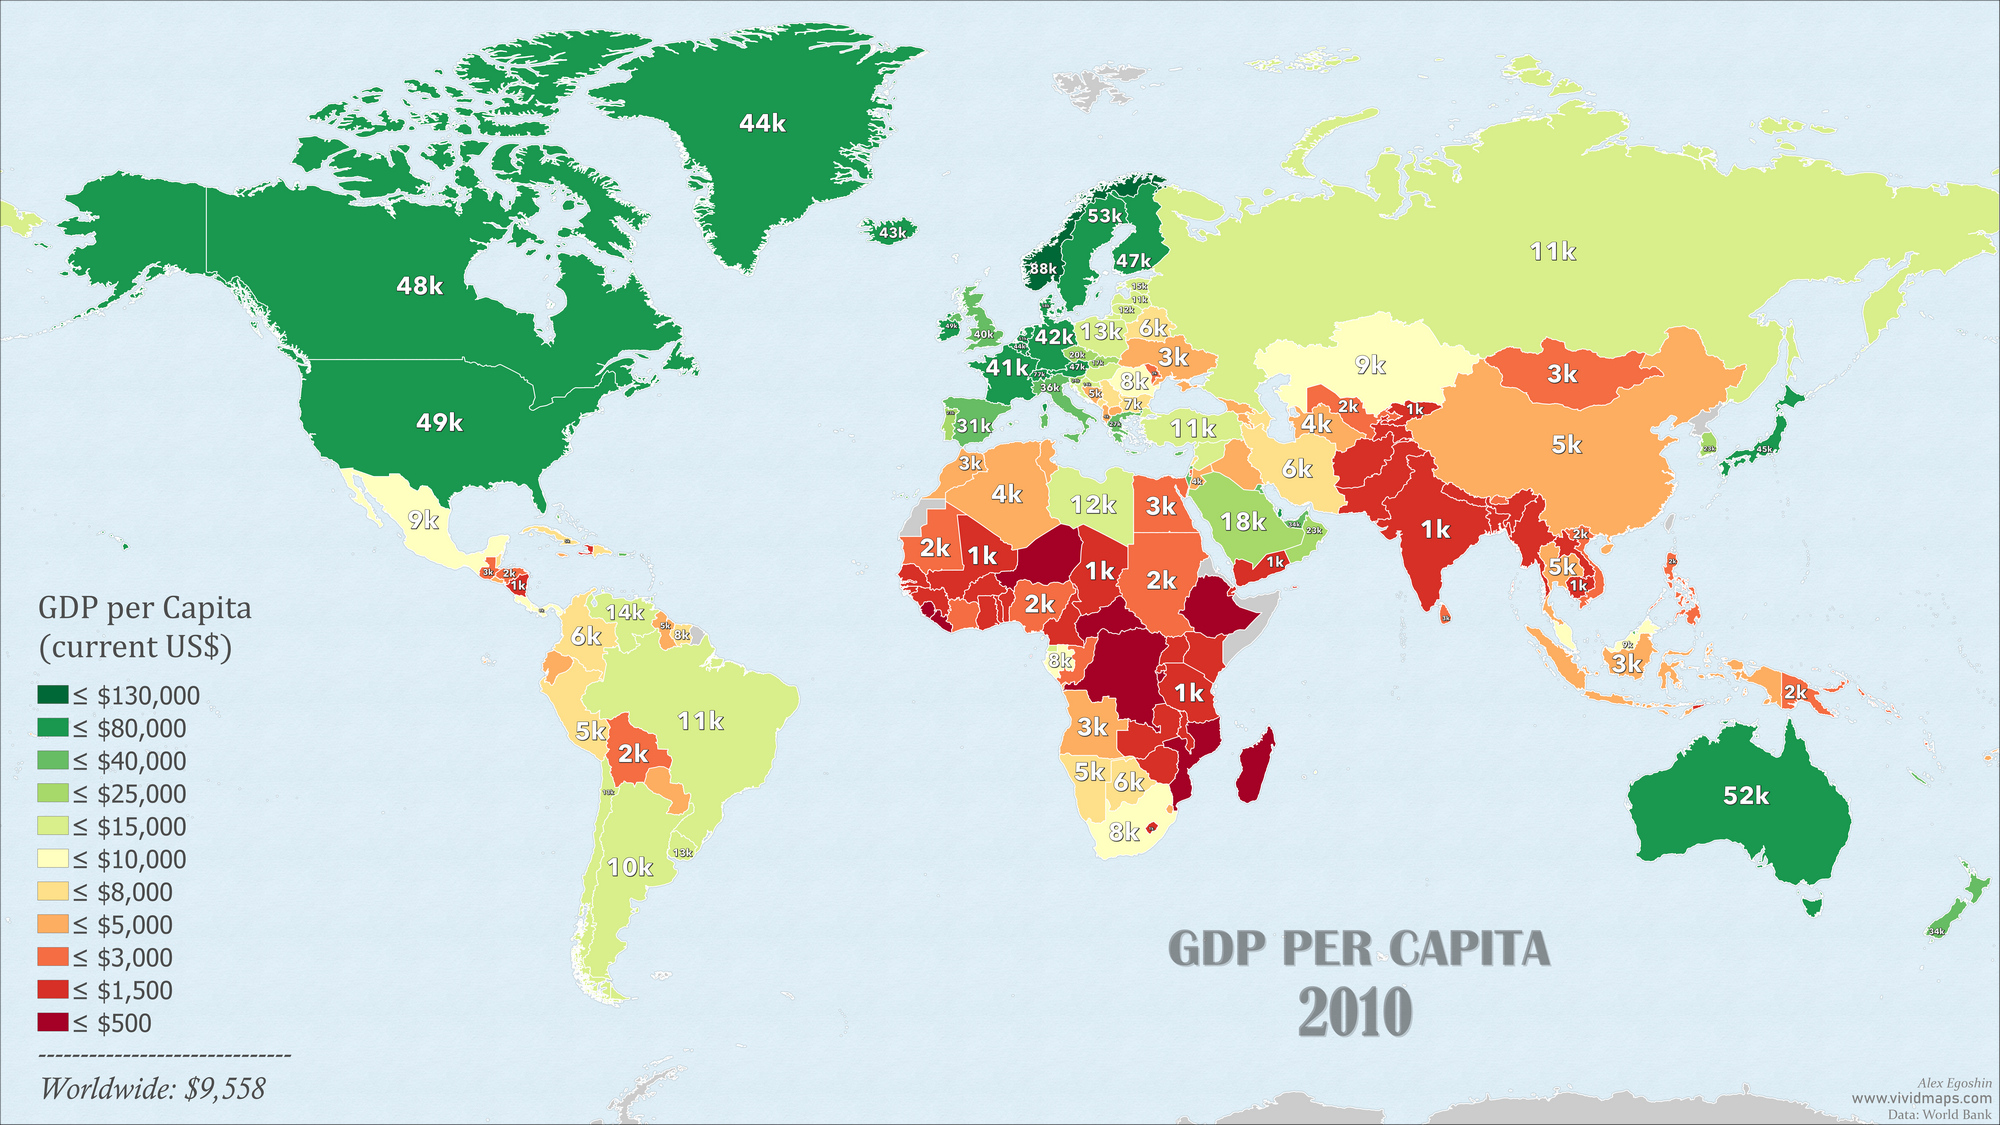
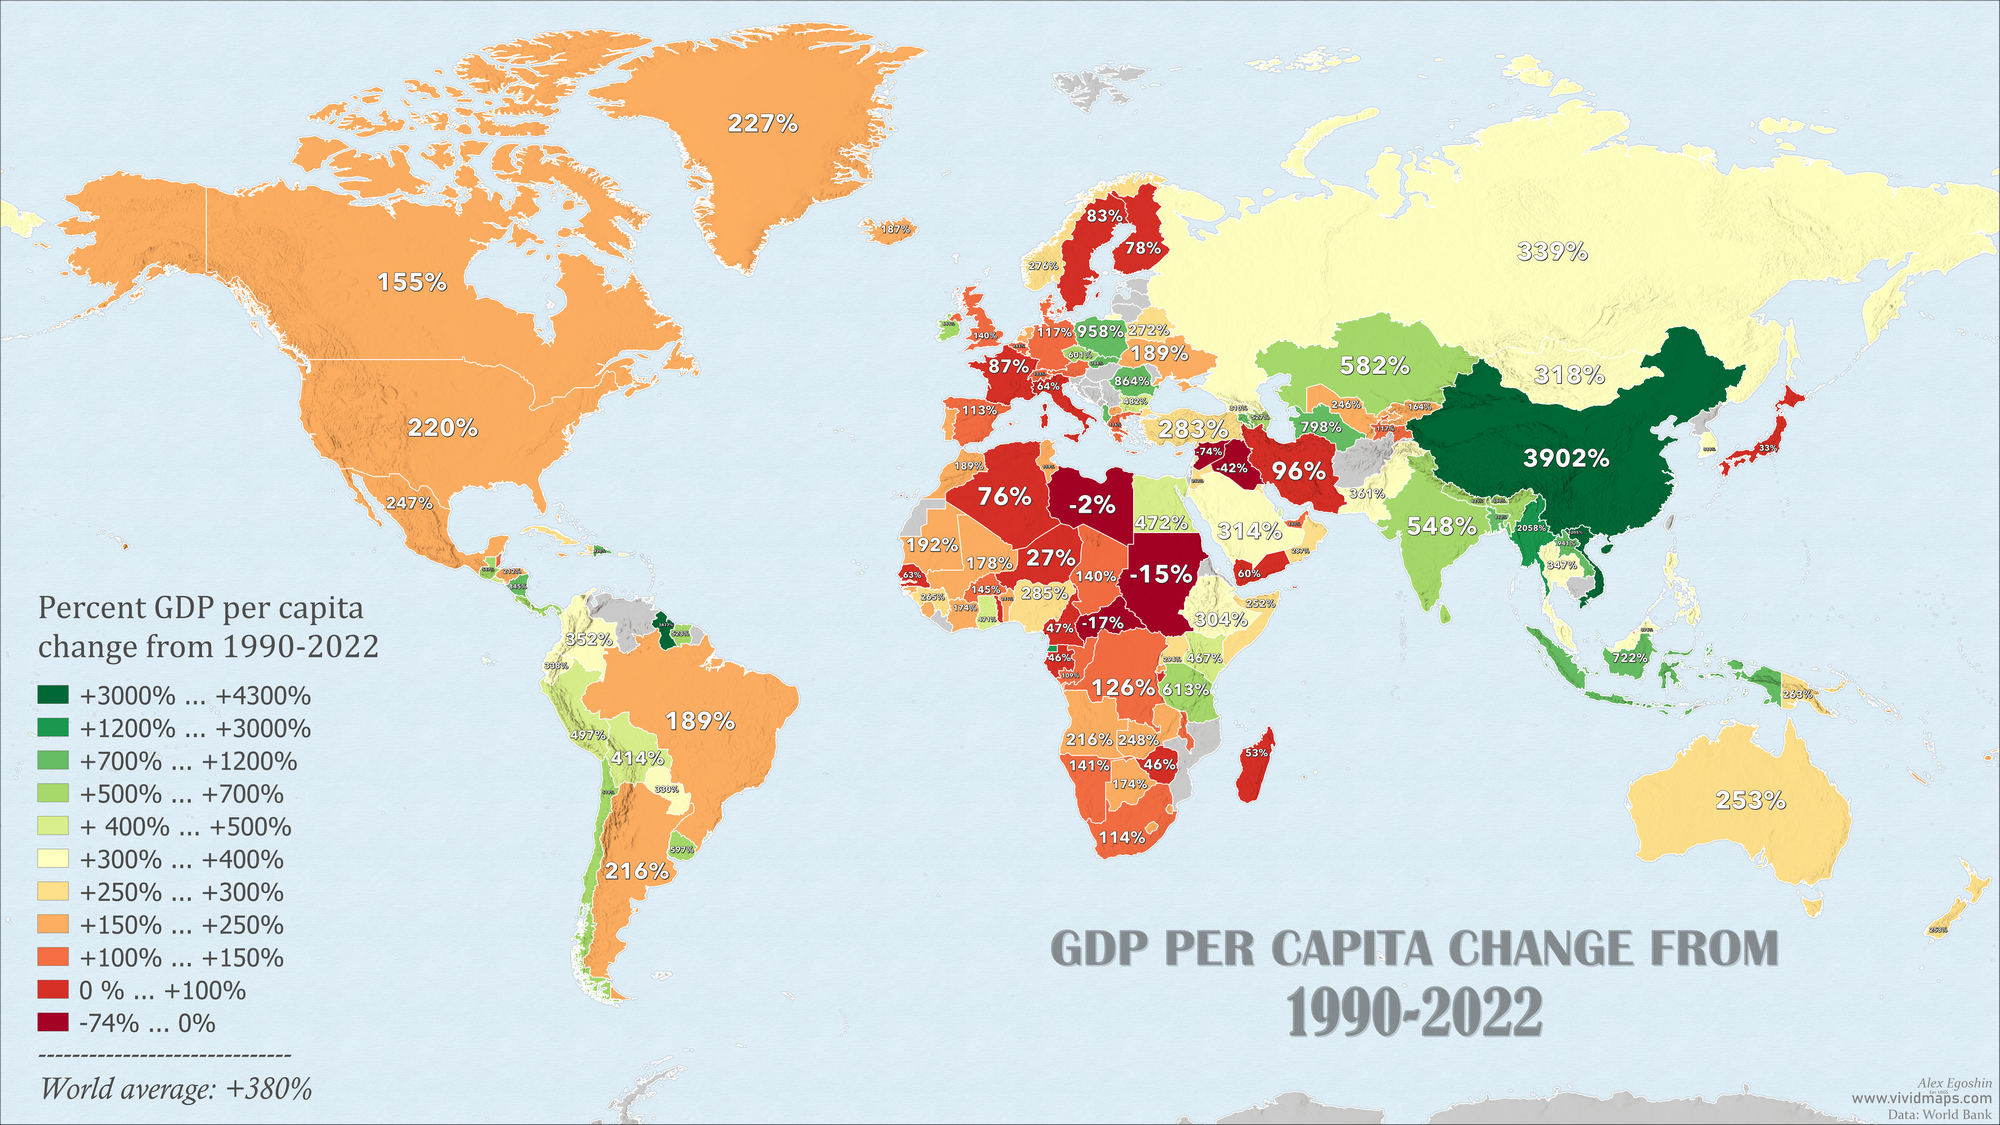
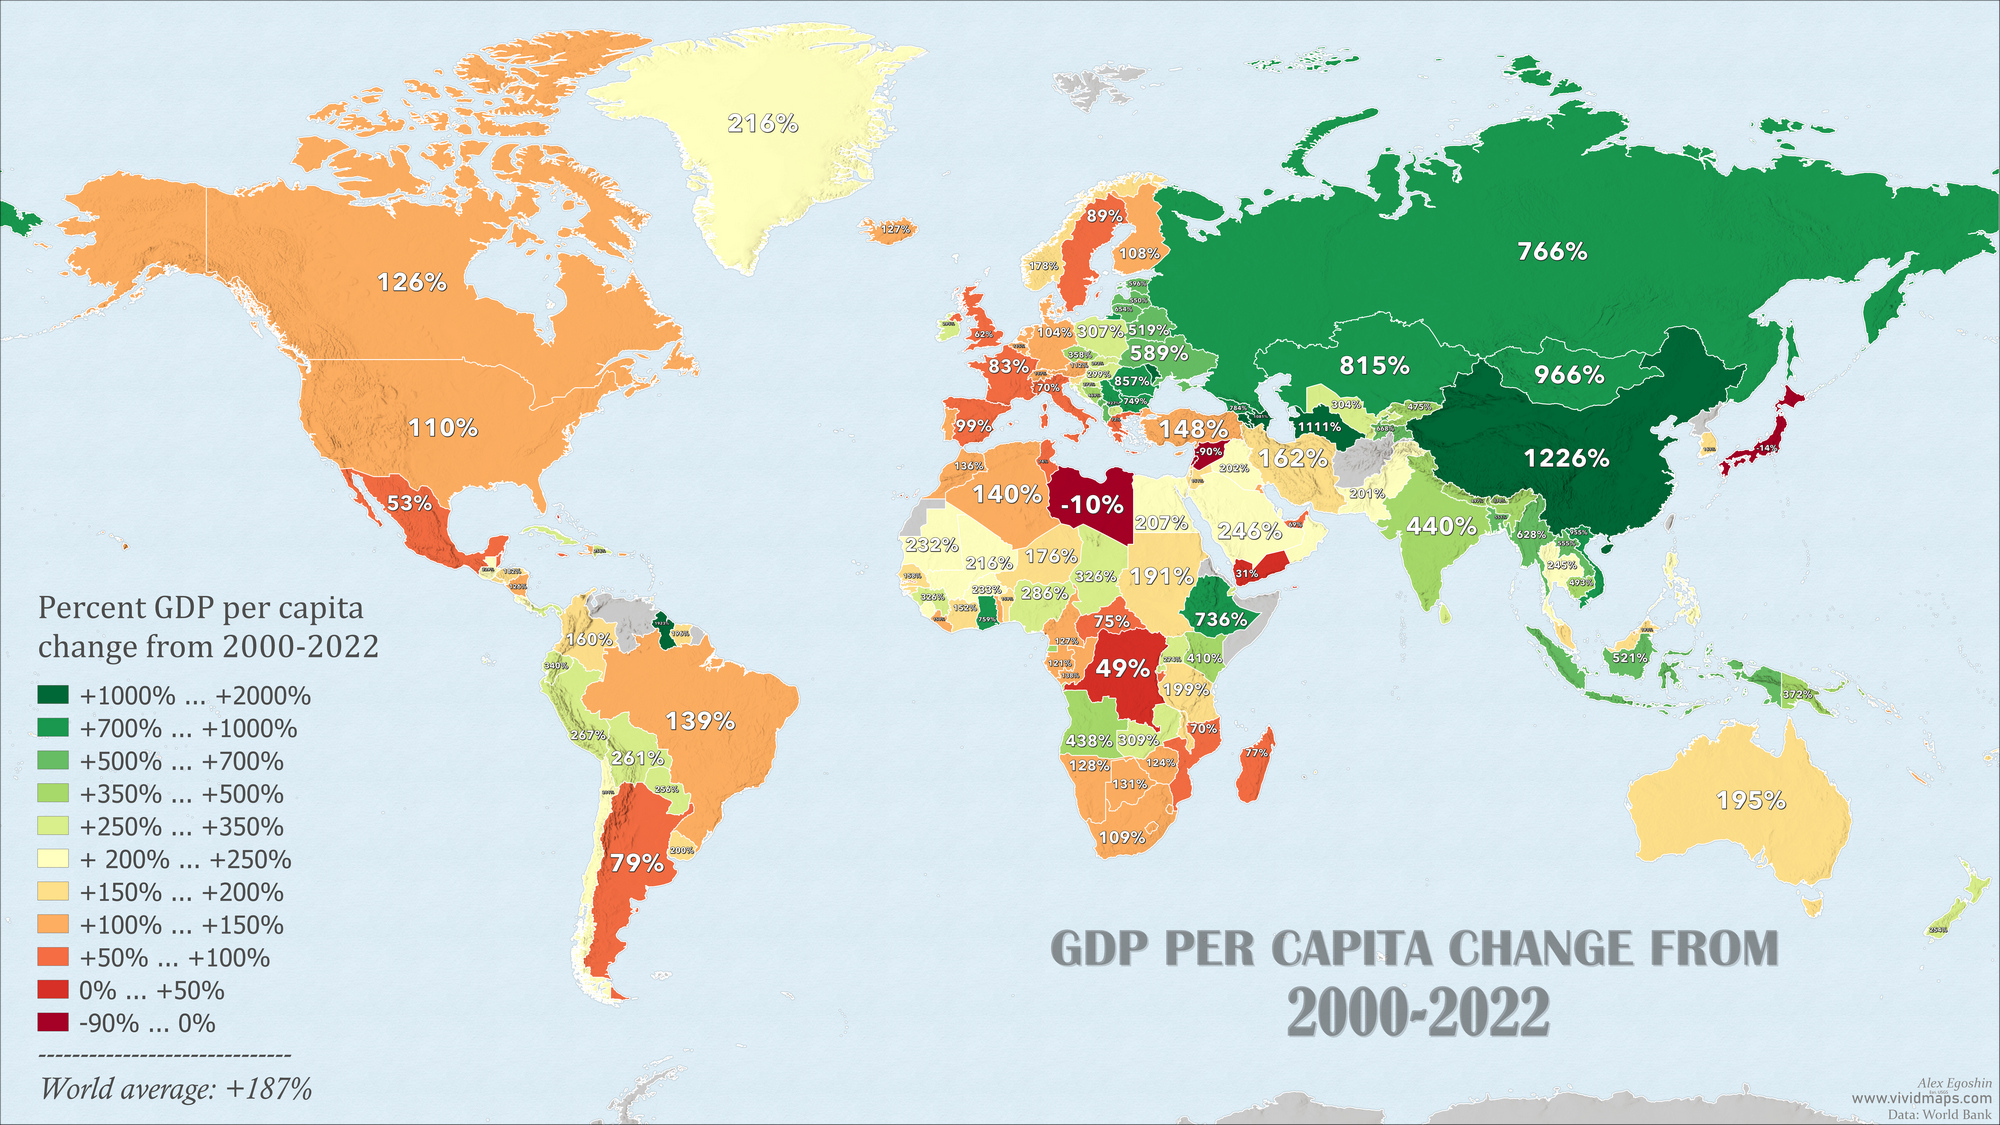
Using World Bank data, I created maps showing the GDP per capita by decade.
In 2022, Monaco claimed the top position in terms of GDP per capita, with a staggering USD 240,000, closely trailed by Luxembourg and Ireland.
Top 10 Nations with the Highest GDP per Capita in 2022
Rank
Country
GDP per Capita (US Dollars)
1
Monaco
240,000
2
Liechtenstein
200,000
3
Luxemburg
126,426
4
Norway
106,149
5
Ireland
104,039
6
Switzerland
92,101
7
Qatar
88,046
8
Singapore
82,808
9
United States
76,399
10
Iceland
72,903
For comparison, based on a knowledge of 99 countries in 1960, the United States ranked the highest in GDP per capita in USD terms with USD 3,007, followed by New Zealand and Canada.
Top 10 Nations with the Highest GDP per Capita in 1960
Rank
Country
GDP per Capita (US Dollars)
1
United States
3,007
2
New Zealand
2,259
3
Canada
2,259
4
Luxembourg
2,242
5
Sweden
2,114
6
Australia
1,811
7
Switzerland
1,787
8
Norway
1,442
9
Iceland
1,415
10
United Kingdom
1,398
Over time, there has been a consistent global increase in GDP per capita, which has correspondingly led to a significant rise in the standard of living worldwide. Here are maps illustrating GDP per capita in previous decades.
Examining historical trends, it’s evident that our quality of life has experienced a remarkable surge. According to the World Bank, the GDP per capita worldwide in 1960 was $457 and in 2022, it was $12,647.
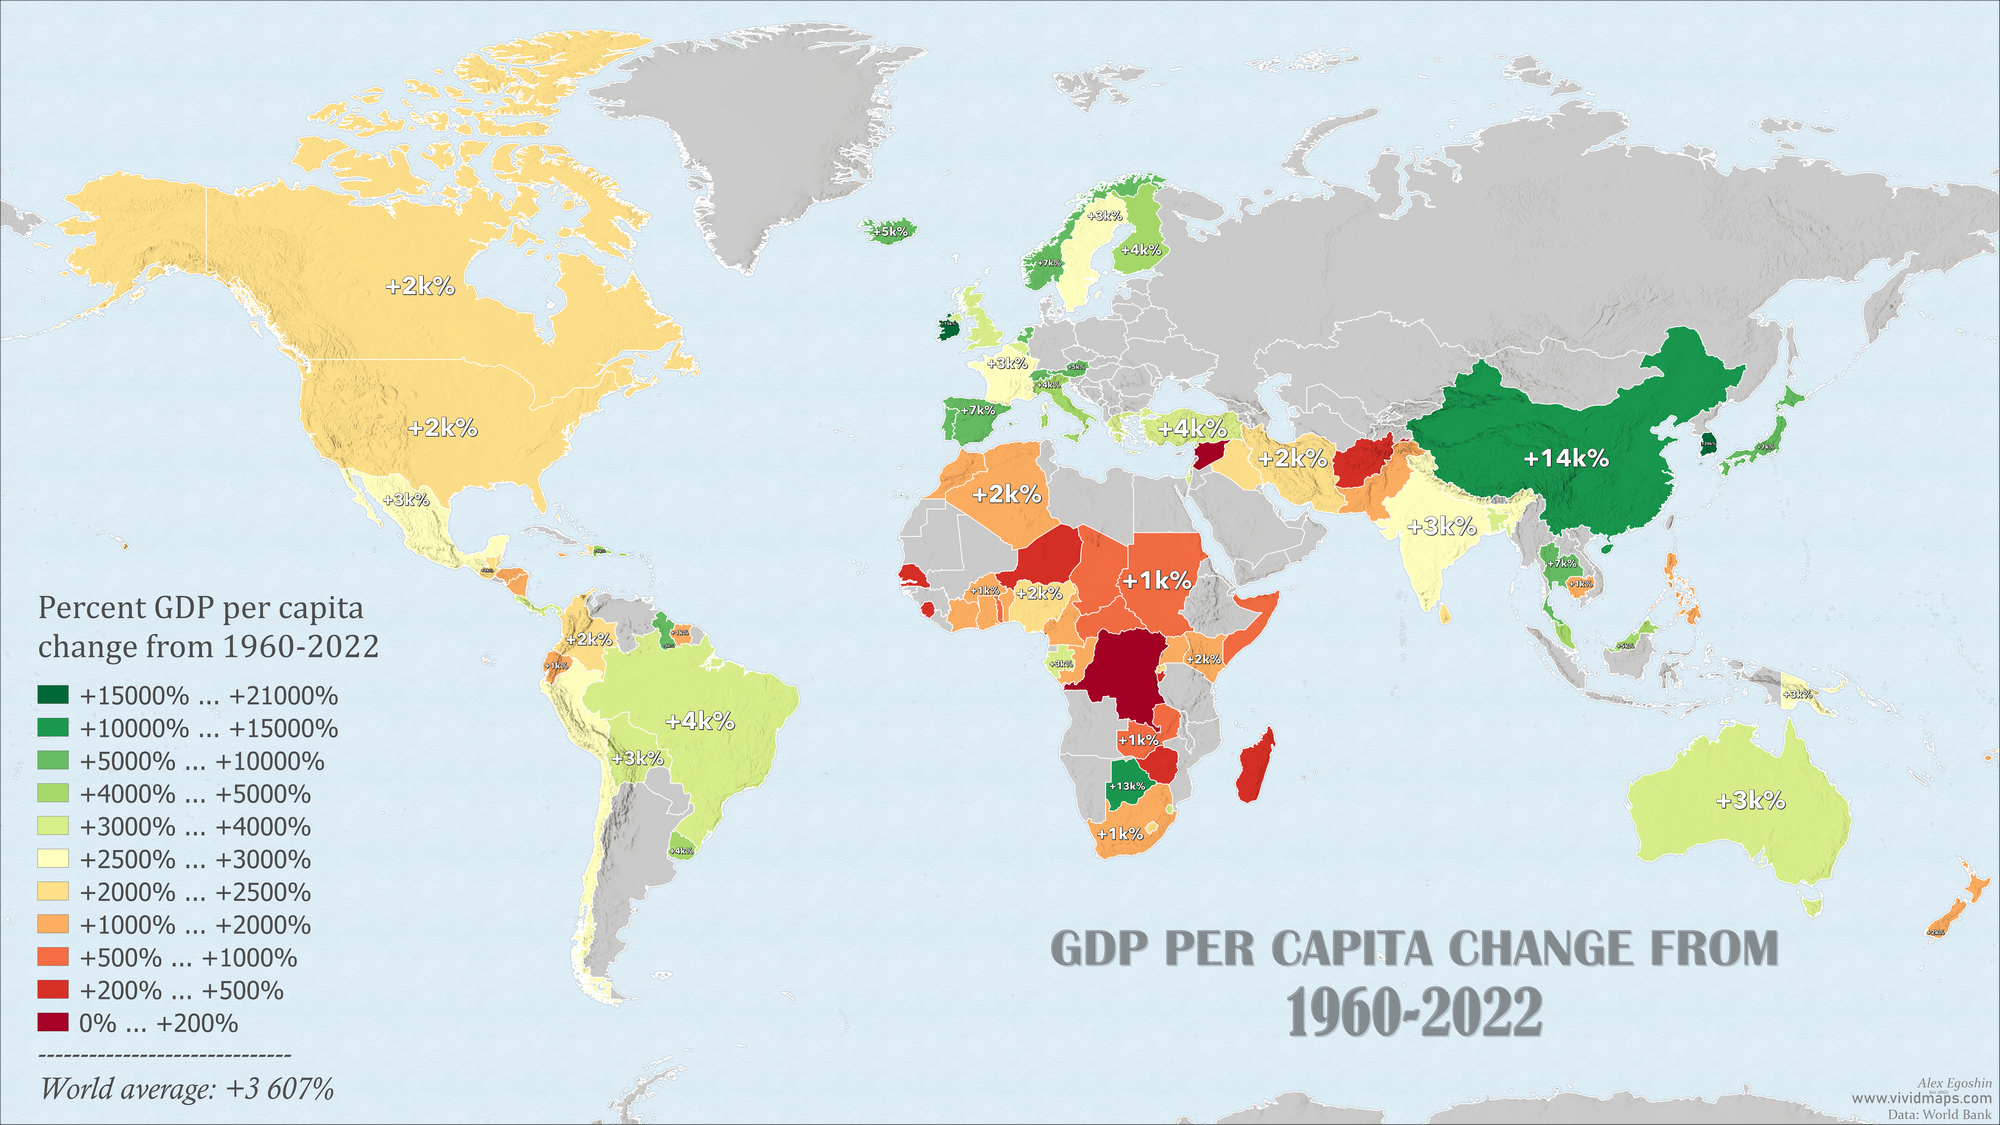
South Korea had the most phenomenal growth in GDP per capita. From 1960 to 2022, the GDP per capita of this country grew by 20,279%.
Top 10 countries by real GDP growth rate (1960-2022)
Rank
Country
GDP growth rate
1
South Korea
+20,279%
2
Singapore
+19,245%
3
Ireland
+15,075%
4
China
+14,109%
5
Botswana
+12,949%
6
Hong Kong
+11,451%
7
Spain
+7,304%
8
Norway
+7,262%
9
Japan
+7,014%
10
Portugal
+6,634%
Here is an animated version of these maps.
Emerging and developing economies, often in Asia and parts of Africa, are projected to experience the highest GDP per capita growth. These nations may benefit from further industrialization, increased productivity, urbanization, and a growing workforce.


")
")


 Every Country Switched to the Metric System—and Who Still Holds Out")


