Personal Income by U.S. County mapped
IIn 2020, personal income increased in 3,040 U.S. counties, decreased in 69, and was unaffected in 3. Personal revenue grew 6.4% in the metropolitan part of the U.S. and rose 7.6% in the nonmetropolitan part.
Below is the map created by Reddit user malxredleader using Bureau of Economic Analysis and U.S. Census Bureau data that shows the highest per capita personal income in each U.S. county in 2020.
This map includes data for government subsidies in response to the COVID-19 pandemic.
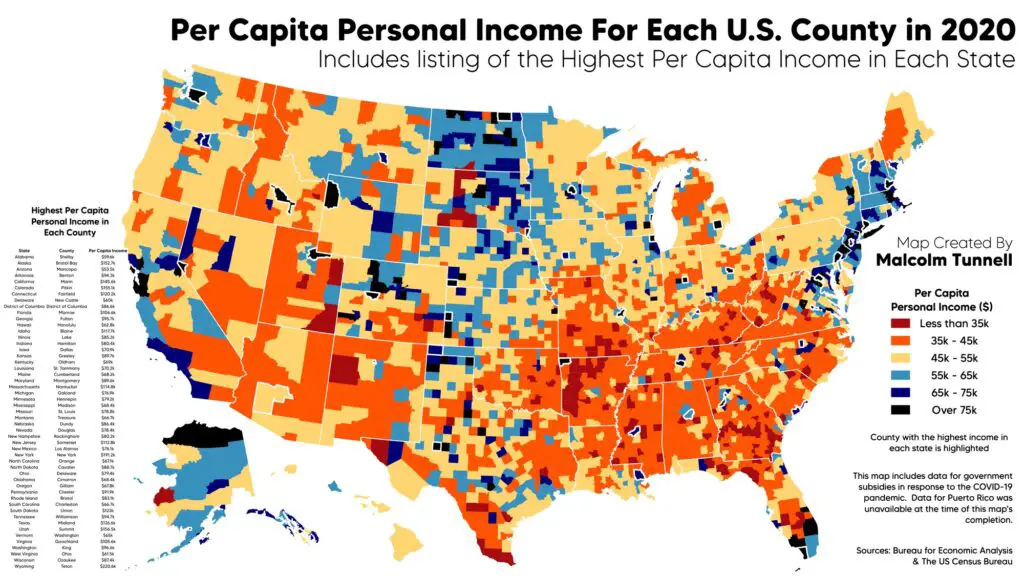
Highest per capita personal income in each U.S. county
| State | County | |
|---|---|---|
| Alabama | Shelby | 59.6 |
| Alaska | Bristol Bay | 152.7 |
| Arizona | Maricopa | 53.5 |
| Arkansas | Benton | 94.3 |
| California | Marin | 145.6 |
| Colorado | Pitkin | 155.1 |
| Connecticut | Fairfield | 120.2 |
| Delaware | New Castle | 60 |
| D.C. | 86.6 | |
| Florida | Monroe | 106.6 |
| Georgia | Fulton | 95.7 |
| Hawaii | Honolulu | 62.8 |
| Idaho | Blaine | 117.7 |
| Illinois | Lake | 85.2 |
| Indiana | Hamilton | 80.4 |
| Iowa | Dallas | 70.9 |
| Kansas | Greeley | 89.7 |
| Kentucky | Oldham | 69 |
| Louisiana | St. Tammany | 70.2 |
| Maine | Cumberland | 68.2 |
| Maryland | Montgomery | 89.6 |
| Massachusetts | Nantucket | 114.8 |
| Michigan | Oakland | 76.9 |
| Minnesota | Hennepin | 79.2 |
| Mississippi | Madison | 68.4 |
| Missouri | St. Louis | 78.8 |
| Montana | Treasure | 66.7 |
| Nebraska | Dundy | 86.4 |
| Nevada | Douglas | 78.4 |
| New Hampshire | Rockingham | 80.2 |
| New Jersey | Somerset | 112.8 |
| New Mexico | Los Alamos | 76.1 |
| New York | New York | 191.2 |
| North Carolina | Orange | 67.1 |
| North Dakota | Cavalier | 88.7 |
| Ohio | Delaware | 79.4 |
| Oklahoma | Cimarron | 68.4 |
| Oregon | Gilliam | 67.8 |
| Pennsylvania | Chester | 91.9 |
| Rhode Island | Bristol | 83.1 |
| South Carolina | Charleston | 66.7 |
| South Dakota | Union | 123 |
| Tennessee | Williamson | 94.7 |
| Texas | Midland | 126.6 |
| Utah | Summit | 156.5 |
| Vermont | Washington | 65 |
| Virginia | Goochland | 105.6 |
| Washington | King | 96.6 |
| West Virginia | Ohio | 61.5 |
| Wisconsin | Ozaukee | 87.4 |
| Wyoming | Teton | 220.6 |




Hey, how about putting together a tool that would allow me or anyone else to select maps and overlay them into either a static picture or an animated gif. Some of this data might be really interesting if combined with other pieces.