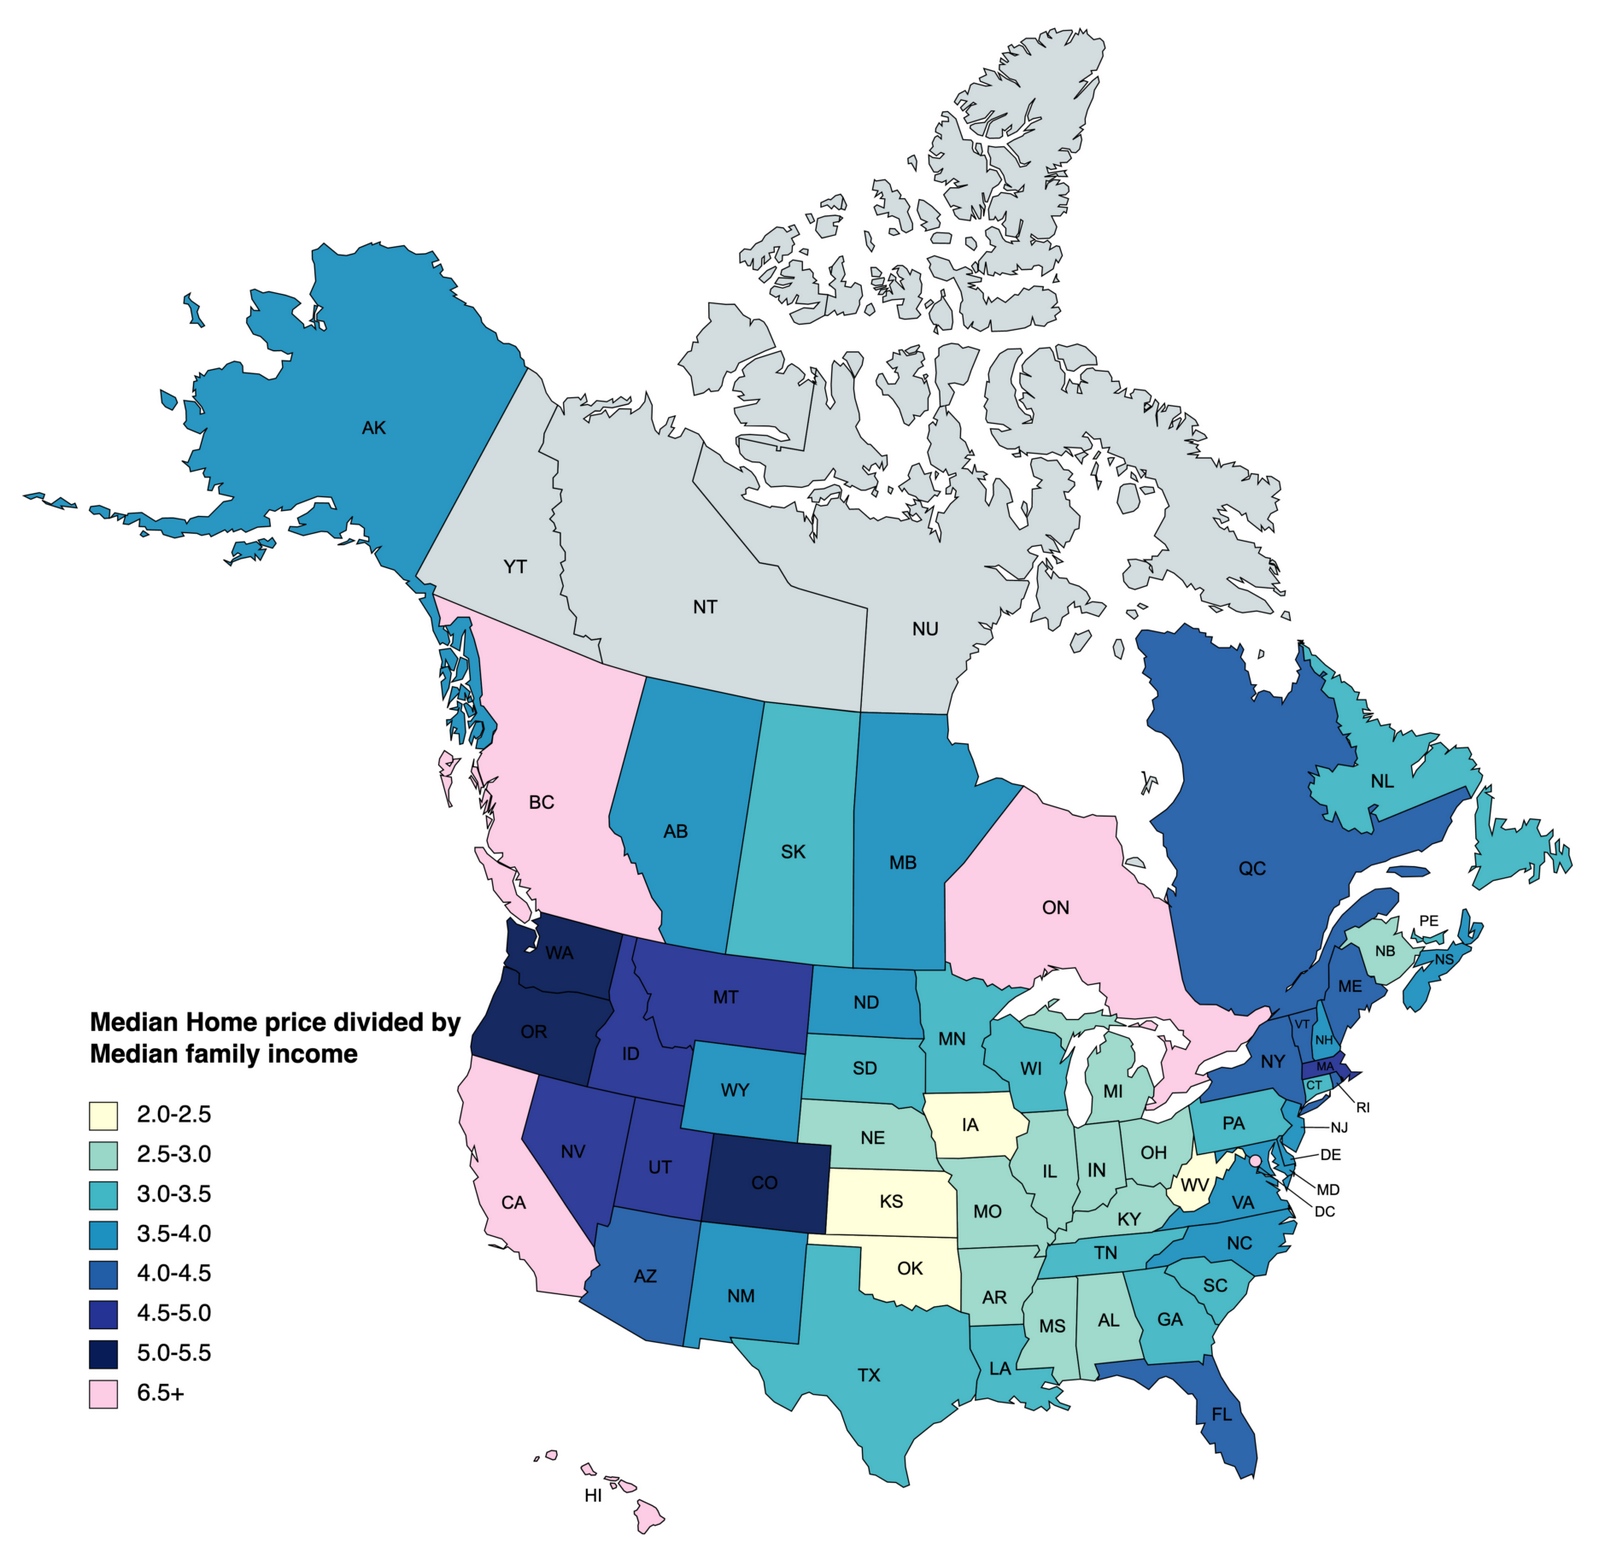
The housing market across North America varies significantly, with some regions requiring much longer work periods to afford a home than others. A fascinating map created by Reddit user Smacpats111111 highlights this variation by showing the median home price in 2021 (US & Canada) divided by the median family income for each US state and Canadian province. This data shows how many years one would need to work, assuming they spent 100% of their pre-tax income on purchasing a home.
The map reveals striking differences in housing affordability across North America. For instance, it would take approximately 2.2 years of work in West Virginia to buy a house, making it the most affordable state in this analysis. On the other end of the spectrum, British Columbia stands out as the most expensive region, with a staggering 8.7 years required to purchase a home.
Rank
State or Province
How Many Years To Buy A House
1
British Columbia
8.68398889
2
Ontario
7.709078
3
Hawaii
7.65867247
4
California
6.89813526
5
District of Columbia
6.79460473
6
Oregon
5.39786454
7
Washington
5.2007066
8
Colorado
5.15798618
9
Massachusetts
4.92592291
10
Montana
4.86065473
11
Nevada
4.76883811
12
Idaho
4.68830637
13
Utah
4.59720243
14
New York
4.46460864
15
Arizona
4.33107727
16
Quebec
4.32752641
17
Rhode Island
4.22667173
18
Florida
4.1394803
19
Maine
4.11234811
20
Vermont
4.03539626
21
Alaska
3.98723878
22
New Mexico
3.92097411
23
New Jersey
3.91373862
24
Wyoming
3.85966802
25
Alberta
3.78365793
26
Virginia
3.73062938
27
New Hampshire
3.72323663
28
North Dakota
3.63925237
29
Delaware
3.62101003
30
Nova Scotia
3.61626551
31
Manitoba
3.61484607
32
Maryland
3.55139616
33
North Carolina
3.52653424
34
Prince Edward Island
3.46880824
35
South Dakota
3.45299246
36
Minnesota
3.44344644
37
Tennessee
3.31583171
38
South Carolina
3.30355523
39
Louisiana
3.26131224
40
Georgia
3.24772507
41
Connecticut
3.24172618
42
Texas
3.23735828
43
Wisconsin
3.14843847
44
Saskatchewan
3.09658467
45
Pennsylvania
3.0664009
46
Newfoundland
3.01470802
47
Illinois
2.9293798
48
Michigan
2.90811292
49
Missouri
2.82993956
50
Kentucky
2.80850942
51
Nebraska
2.78169827
52
Mississippi
2.76253494
53
Indiana
2.70194261
54
Alabama
2.6863378
55
Arkansas
2.61686959
56
Ohio
2.56427134
57
New Brunswick
2.51184328
58
Iowa
2.47823832
59
Kansas
2.42654662
60
Oklahoma
2.36797737
61
West Virginia
2.21568066
Here are some key patterns and insights from the data:
Most Affordable Regions: States like West Virginia, Oklahoma, and Kansas require less than 2.5 years of work to afford a home. These regions benefit from relatively low median home prices combined with reasonable family incomes.
Least Affordable Regions: British Columbia (8.7 years), Ontario (7.7 years), Hawaii (7.7 years), California (6.9 years), and the District of Columbia (6.8 years) are the most challenging places to buy a home, where high property prices far outstrip median incomes.
Why Are House Prices So High in Certain Areas?
Several factors contribute to the high house prices in British Columbia, Ontario, California, and Hawaii:
Demand vs. Supply: These regions have a high demand for housing due to desirable living conditions, job opportunities, and amenities. However, the supply of homes has not kept pace, driving prices up.
Geographical Constraints: Hawaii and California have limited land available for development due to geographical constraints like mountains and coastlines, which further drive up prices.
Economic Factors: Major cities in these regions, such as Vancouver, Toronto, Los Angeles, and Honolulu, are economic hubs with high-paying jobs. This attracts a large number of buyers, including international investors, contributing to higher prices.
Housing Affordability Trends Over Time
The trend of housing affordability in the U.S. and Canada has been shifting over time, with a general increase in home prices outpacing income growth in many regions. Factors such as low interest rates, increasing demand, and limited housing supply have exacerbated this trend.
Predictions for the Future:
The U.S.: In the United States, home prices are expected to continue rising, especially in high-demand areas. However, some regions might see a stabilization or slower growth due to potential economic downturns or changes in housing policies.
Canada: Similarly, Canada is likely to experience ongoing challenges in housing affordability, particularly in major cities. Government interventions and changes in immigration policies might impact future trends.
Explore Maps of North America
For those interested in exploring more about North America’s geography, check out these maps of North America available on Amazon: