How Much Cheaper It Is To Rent Than Buy A Home In Every U.S. State
This post may contain affiliate links. As an Amazon Associate, we earn from qualifying purchases.
As reported by the U.S. Census Bureau, homeownership rates witnessed a decline in the first quarter of 2019, marking a departure from the consistent upward trend observed over the preceding two years. Various factors, including student loan debt, financial uncertainty, and soaring housing prices, are discouraging certain potential homeowners from pursuing property ownership.
HowMuch.net used data from the US Census Bureau to create a map that shows whether it’s more affordable to buy or rent a house based on location within the U.S. state.

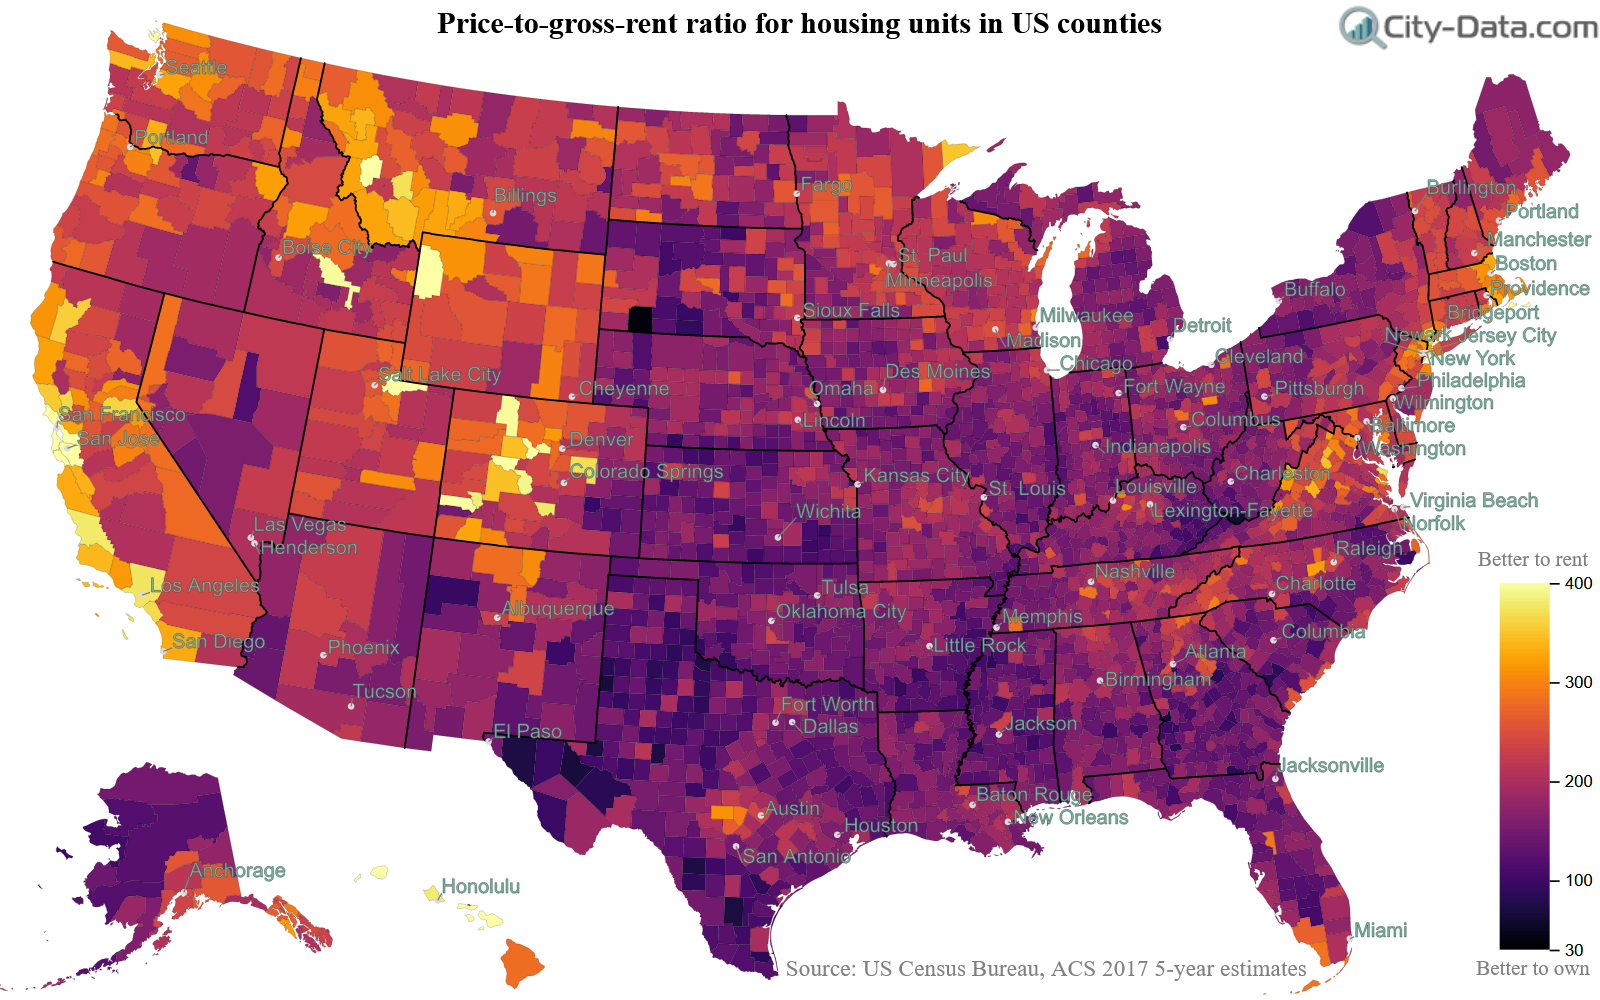
The U.S. states colored turquoise on the map above show where it is reasonable to rent a residence than buy a home, with the darker tints of turquoise color representing a more significant percentage contrast between buying and renting. In the purple U.S. states, it is cheaper to buy than to rent. Florida is the only state where it is more affordable to buy than rent.

In most U.S. states cheaper to rent than own property. The Sunshine State is the lone exception, as the median monthly mortgage payment in Florida comes down to $947, slightly lower than the median monthly rent, which is $975.
Top 20 U.S. States where renting is cheaper than buying
- Puerto Rico – 85% cheaper to rent than to buy
- Montana – 42% cheaper to rent than buy
- Wyoming – 40% cheaper to rent than buy
- Alabama – 39% cheaper to rent than buy
- Kentucky – 35% cheaper to rent than buy
- Louisiana – 34% cheaper to rent than buy
- North Dakota – 33% cheaper to rent than buy
- South Dakota – 33% cheaper to rent than buy
- Mississippi – 33% cheaper to rent than buy
- Rhode Island – 31% cheaper to rent than buy
- New Mexico – 30% cheaper to rent than buy
- Oklahoma – 29% cheaper to rent than buy
- California – 28% cheaper to rent than buy
- West Virginia – 28% cheaper to rent than buy
- Hawaii – 28% cheaper to rent than buy
- South Carolina – 27% cheaper to rent than buy
- Arkansas – 27% cheaper to rent than buy
- Nebraska – 27% cheaper to rent than buy
- Virginia – 26% cheaper to rent than buy
- Missouri – 26% cheaper to rent than buy
Contrary to popular opinion about increasing home prices in major coastal hubs like NYC and San Francisco, requirements for real estate buyers are slightly friendlier on the West Coast and the East Coast compared to the South or Great Plains. In the South and Great Plains, it is still remarkably reasonable to rent than to purchase, often leading to savings of 33 percent or more on housing prices. The geographic exceptions are Puerto Rico ($688 mortgage vs. $371 rent) and Rhode Island ($1,089 mortgage vs. $832 rent). If you still have fantasies of buying property, regardless of where you reside, you may find it simpler to rent for several years to save up for a down payment.
Is it more common to own or rent in every U.S. state?
State | Number Owned Properties | Number Rented Properties | %Owned | %Rented | Median contract rent | Mortgage Cost | % Cheaper to rent than buy |
---|---|---|---|---|---|---|---|
Puerto Rico | 802.024 | 389.281 | 67.32% | 32.68% | $371 | $688 | 85% |
Montana | 292.585 | 130.506 | 69.15% | 30.85% | $667 | $946 | 42% |
Wyoming | 159.792 | 66.004 | 70.77% | 29.23% | $703 | $987 | 40% |
Alabama | 1,253,199 | 588.466 | 68.05% | 31.95% | $565 | $786 | 39% |
Kentucky | 1,146,668 | 578.366 | 66.47% | 33.53% | $571 | $771 | 35% |
Louisiana | 1,132,229 | 604.894 | 65.18% | 34.82% | $678 | $907 | 34% |
Mississippi | 748.055 | 343.925 | 68.50% | 31.50% | $574 | $762 | 33% |
North Dakota | 200.554 | 115.752 | 63.41% | 36.59% | $693 | $922 | 33% |
South Dakota | 233.092 | 111.168 | 67.71% | 32.29% | $621 | $825 | 33% |
Kansas | 743.508 | 385.475 | 65.86% | 34.14% | $636 | $831 | 31% |
Rhode Island | 248.723 | 160.025 | 60.85% | 39.15% | $832 | $1,089 | 31% |
New Mexico | 521.45 | 246.255 | 67.92% | 32.08% | $697 | $904 | 30% |
Oklahoma | 962.483 | 507.881 | 65.46% | 34.54% | $620 | $801 | 29% |
California | 7,125,090 | 5,880,007 | 54.79% | 45.21% | $1,320 | $1,696 | 28% |
West Virginia | 518.882 | 196.426 | 72.54% | 27.46% | $523 | $672 | 28% |
Hawaii | 268.078 | 190 | 58.52% | 41.48% | $1,434 | $1,840 | 28% |
South Carolina | 1,309,670 | 595.43 | 68.75% | 31.25% | $665 | $844 | 27% |
Arkansas | 752.399 | 400.683 | 65.25% | 34.75% | $548 | $697 | 27% |
Nebraska | 500.086 | 254.404 | 66.28% | 33.72% | $657 | $835 | 27% |
Virginia | 2,077,417 | 1,043,463 | 66.57% | 33.43% | $1,005 | $1,271 | 26% |
Missouri | 1,596,870 | 788.265 | 66.95% | 33.05% | $628 | $789 | 26% |
Pennsylvania | 3,421,017 | 1,587,734 | 68.30% | 31.70% | $743 | $929 | 25% |
North Carolina | 2,586,616 | 1,368,453 | 65.40% | 34.60% | $698 | $869 | 24% |
District of Columbia | 118.805 | 162.67 | 42.21% | 57.79% | $1,408 | $1,749 | 24% |
Massachusetts | 1,623,515 | 981.439 | 62.32% | 37.68% | $1,084 | $1,338 | 23% |
Tennessee | 1,693,790 | 894.865 | 65.43% | 34.57% | $666 | $817 | 23% |
Texas | 5,964,183 | 3,659,691 | 61.97% | 38.03% | $843 | $1,029 | 22% |
Ohio | 3,070,181 | 1,597,011 | 65.78% | 34.22% | $627 | $764 | 22% |
Utah | 681.563 | 293.885 | 69.87% | 30.13% | $865 | $1,059 | 22% |
Georgia | 2,354,922 | 1,390,152 | 62.88% | 37.12% | $782 | $946 | 21% |
Idaho | 435.493 | 189.642 | 69.66% | 30.34% | $698 | $844 | 21% |
Wisconsin | 1,565,599 | 784.694 | 66.61% | 33.39% | $699 | $832 | 19% |
Iowa | 900.362 | 357.143 | 71.60% | 28.40% | $628 | $748 | 19% |
Oregon | 1,007,015 | 596.62 | 62.80% | 37.20% | $935 | $1,101 | 18% |
Connecticut | 898.234 | 458.528 | 66.20% | 33.80% | $963 | $1,133 | 18% |
New York | 3,930,033 | 3,374,299 | 53.80% | 46.20% | $1,116 | $1,310 | 17% |
New Jersey | 2,053,929 | 1,164,869 | 63.81% | 36.19% | $1,151 | $1,347 | 17% |
Maine | 395.809 | 145.15 | 73.17% | 26.83% | $720 | $844 | 17% |
Illinois | 3,182,232 | 1,626,440 | 66.18% | 33.82% | $852 | $986 | 16% |
Minnesota | 1,547,594 | 614.617 | 71.57% | 28.43% | $859 | $997 | 16% |
New Hampshire | 369.037 | 159.663 | 69.80% | 30.20% | $953 | $1,105 | 16% |
Delaware | 253.948 | 103.989 | 70.95% | 29.05% | $935 | $1,078 | 15% |
Alaska | 159.344 | 91.397 | 63.55% | 36.45% | $1,085 | $1,253 | 15% |
Washington | 1,783,549 | 1,056,828 | 62.79% | 37.21% | $1,087 | $1,237 | 14% |
Nevada | 619.309 | 475.304 | 56.58% | 43.42% | $903 | $1,031 | 14% |
Arizona | 1,652,321 | 900.651 | 64.72% | 35.28% | $858 | $967 | 13% |
Indiana | 1,765,500 | 791.799 | 69.04% | 30.96% | $633 | $706 | 12% |
Maryland | 1,472,500 | 734.843 | 66.71% | 33.29% | $1,193 | $1,319 | 11% |
Michigan | 2,803,372 | 1,126,645 | 71.33% | 28.67% | $693 | $765 | 10% |
Colorado | 1,394,824 | 744.383 | 65.20% | 34.80% | $1,125 | $1,227 | 9% |
Vermont | 178.405 | 78.224 | 69.52% | 30.48% | $844 | $882 | 5% |
Florida | 5,010,187 | 2,679,777 | 65.15% | 34.85% | $975 | $947 | 0.97% |
Price-to-gross-rent ratio for housing units in the United States.
