Largest Ancestry by U.S. County
According to the 2010 U.S. Census, America’s most populous ancestry groups were Germans (16.4%), African American (12.2%), and Irish (11.8%).
The most massive wave of Germans came to the United States through the middle of the nineteenth century, avoiding civilian crises and a high unemployment rate. Nowadays, most German-Americans live in the non-coastal states, with the most significant number in Maricopa County (Arizona).
Most African Americans are the descendants of slaves from Sub-Saharan Africa. Nowadays, the 10 U.S. states have the largest black population: California, Georgia, Florida, Georgia, Illinois, New York, Maryland, Louisiana, North Carolina, Texas, Maryland, Virginia, and Louisiana. These U.S. states combined represent 58 percent of the entire U.S. black population.
The great starvation of the 1840s triggered mass emigration from Ireland. Between the 1820s and the 1920s, approximately 4.6 million Irish migrated to the U.S., many of which resided in big cities like New York City, Boston, Chicago, San Francisco, and Philadelphia.
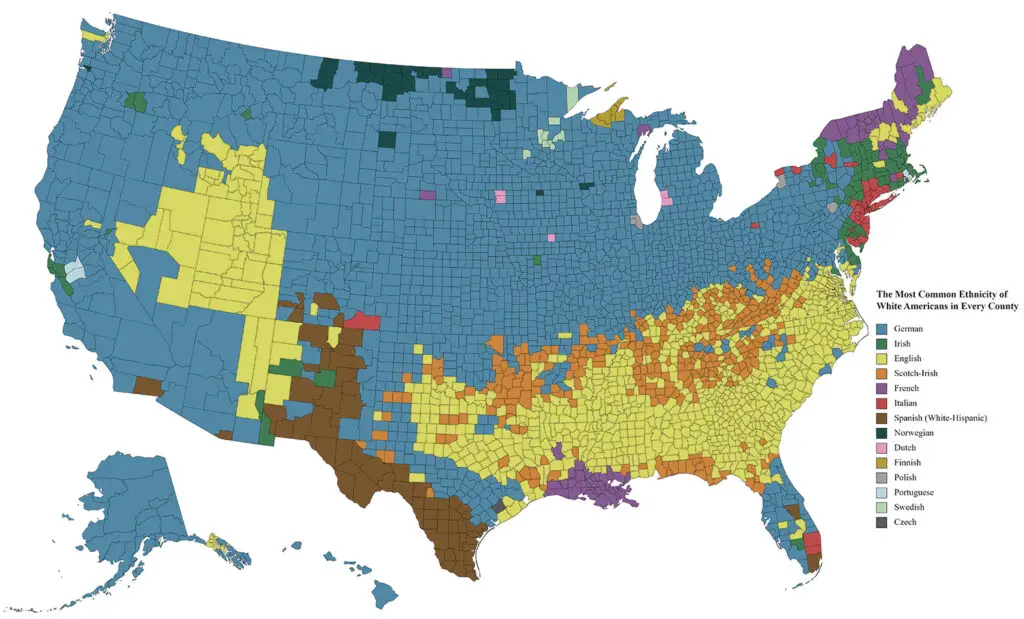
The map below highlights the national origin claimed by American citizens in each U.S. county.
Largest ancestry by country in every county

African Americans and all the Natives presented on the map are not referred to as a particular nation, but they are still part of the wide range of different ethnicities present in the U.S. “Local Native” – people who identify themselves as Native but not as part of the four major Native nationalities (Cherokee, Chippewa, Navajo, and Sioux).
Ancestry groups by the total population
German 16.4% (49,836,146)
African American 12.2% (37,122,425)
Irish 11.8% (35,751,133)
Mexican 10.1% (30,731,943)
English 9.0% (27,403,063)
Italian 5.8% (17,566,693)
Polish 3.2% (9,835,459)
French 3.1% (9,326,180)
Dutch 1.6% (4,950,041)
Norwegian 1.5% (4,602,337)
Puerto Rican 1.5% (4,455,149)
Chinese 1.1% (3,294,615)
Filipino 0.8% (2,523,448)
Cuban 0.6% (1,690,061)
Local Native 0.5% (1,665,269)
Portuguese 0.5% (1,426,121)
Japanese 0.3% (817,103)
Navajo 0.1% (298,164)
Cherokee 0.1% (282,760)
Sioux <0.1% (119,236)
Chippewa <0.1% (115,036)
European Americans
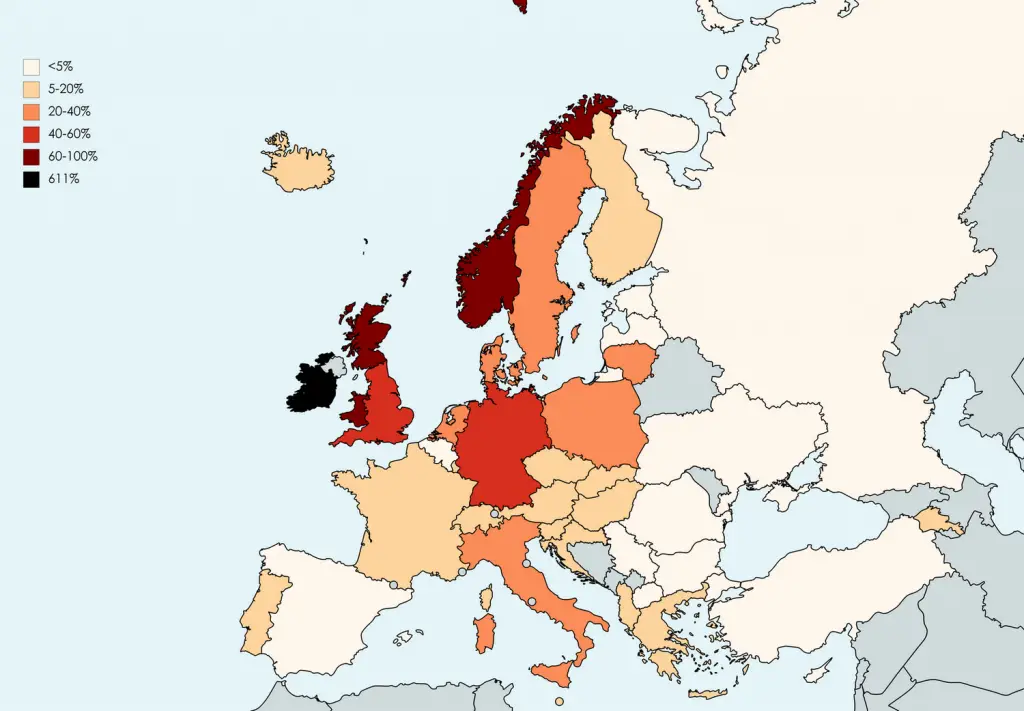
Let’s compare the American population by ancestry with the ethnic groups that live in Europe. It turns out that most Irish people currently live in the United States, not Ireland. Because Ireland had never recovered population-wise from the potato famine and following the mass emigration, their population peaked in 1845. Then it decreased by over 50% before gradually growing to about 2/3 of the historical peak.
Besides Scotland and Wales, many Norwegians live in the United States. About 1/3 of the Norwegian population emigrated to America.
The United States population by ancestry relative to homeland population
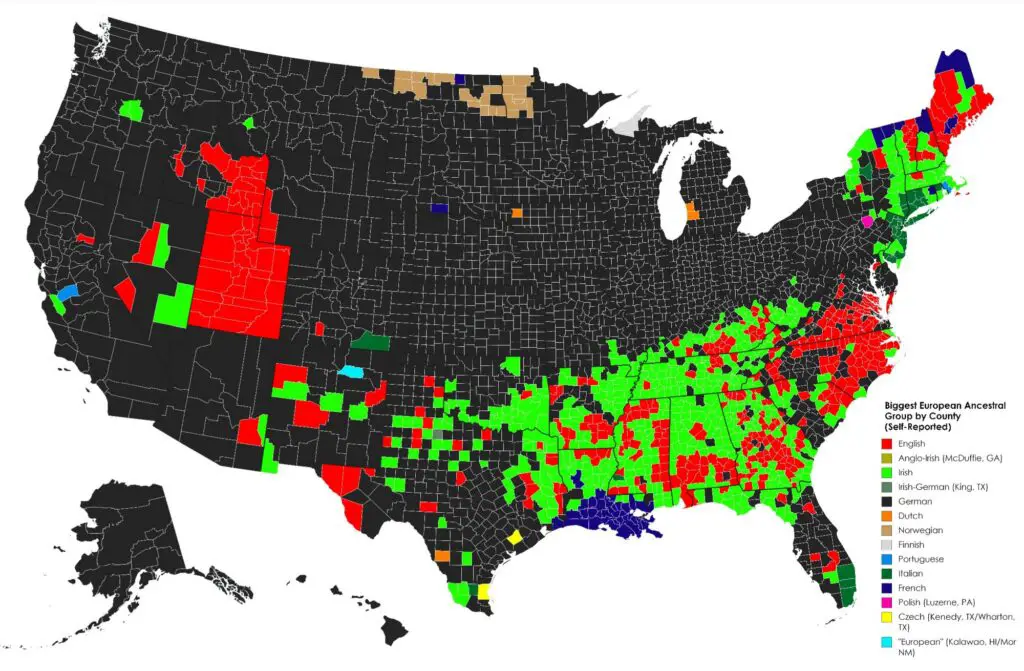
Most Irish people now live in the southeastern United States. Germans are the most significant European ancestral group in most U.S. counties.
Biggest European Ancestral Group by U.S. county
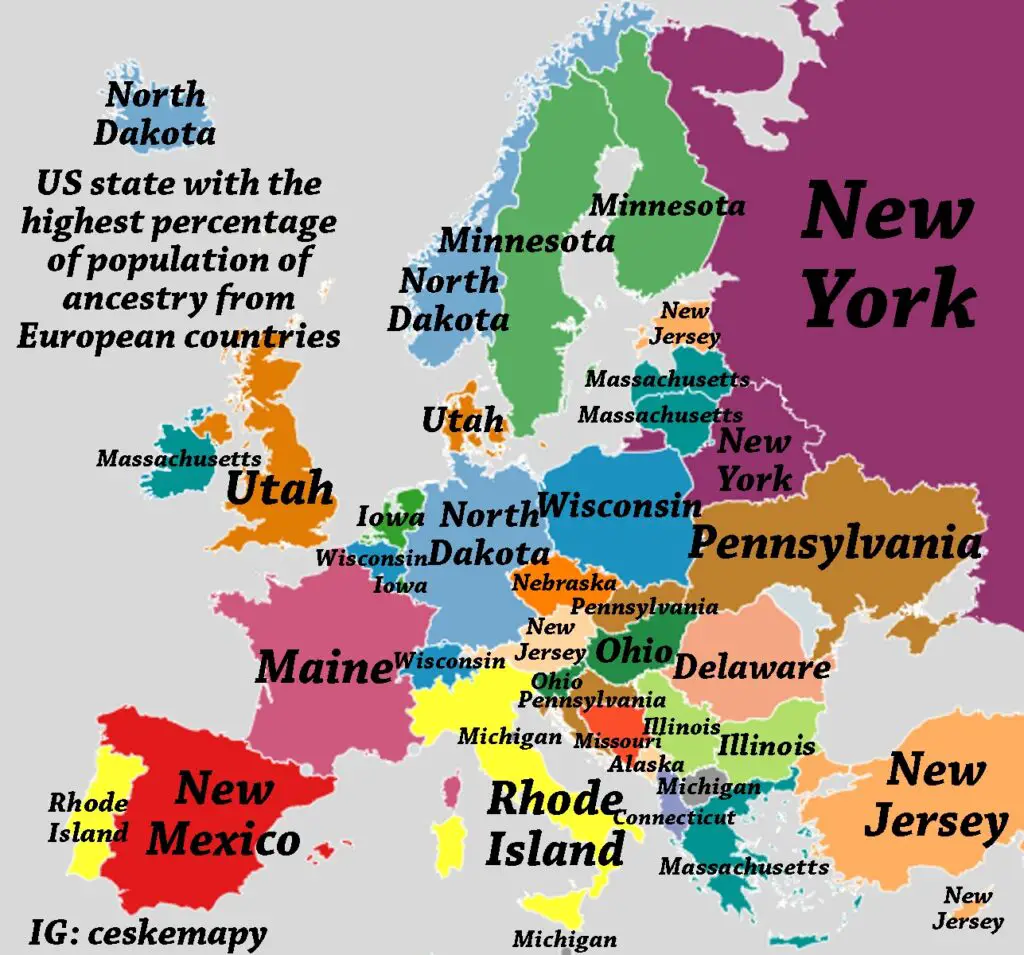
The map below shows in which state you can find the highest percentage of people with ancestry from every European country.
U.S. State With the Highest Percentage of Population of Ancestry from European Countries
The maps explaining how immigration to America has changed over time you can find here.
Asian American
Asian Americans are expatriates from specific areas in Asia and descendants of such immigrants. In 2020, Americans who identified as Asian alone (20 million) or in combination with other races (4 million) made up 7.2 percent of the American population.
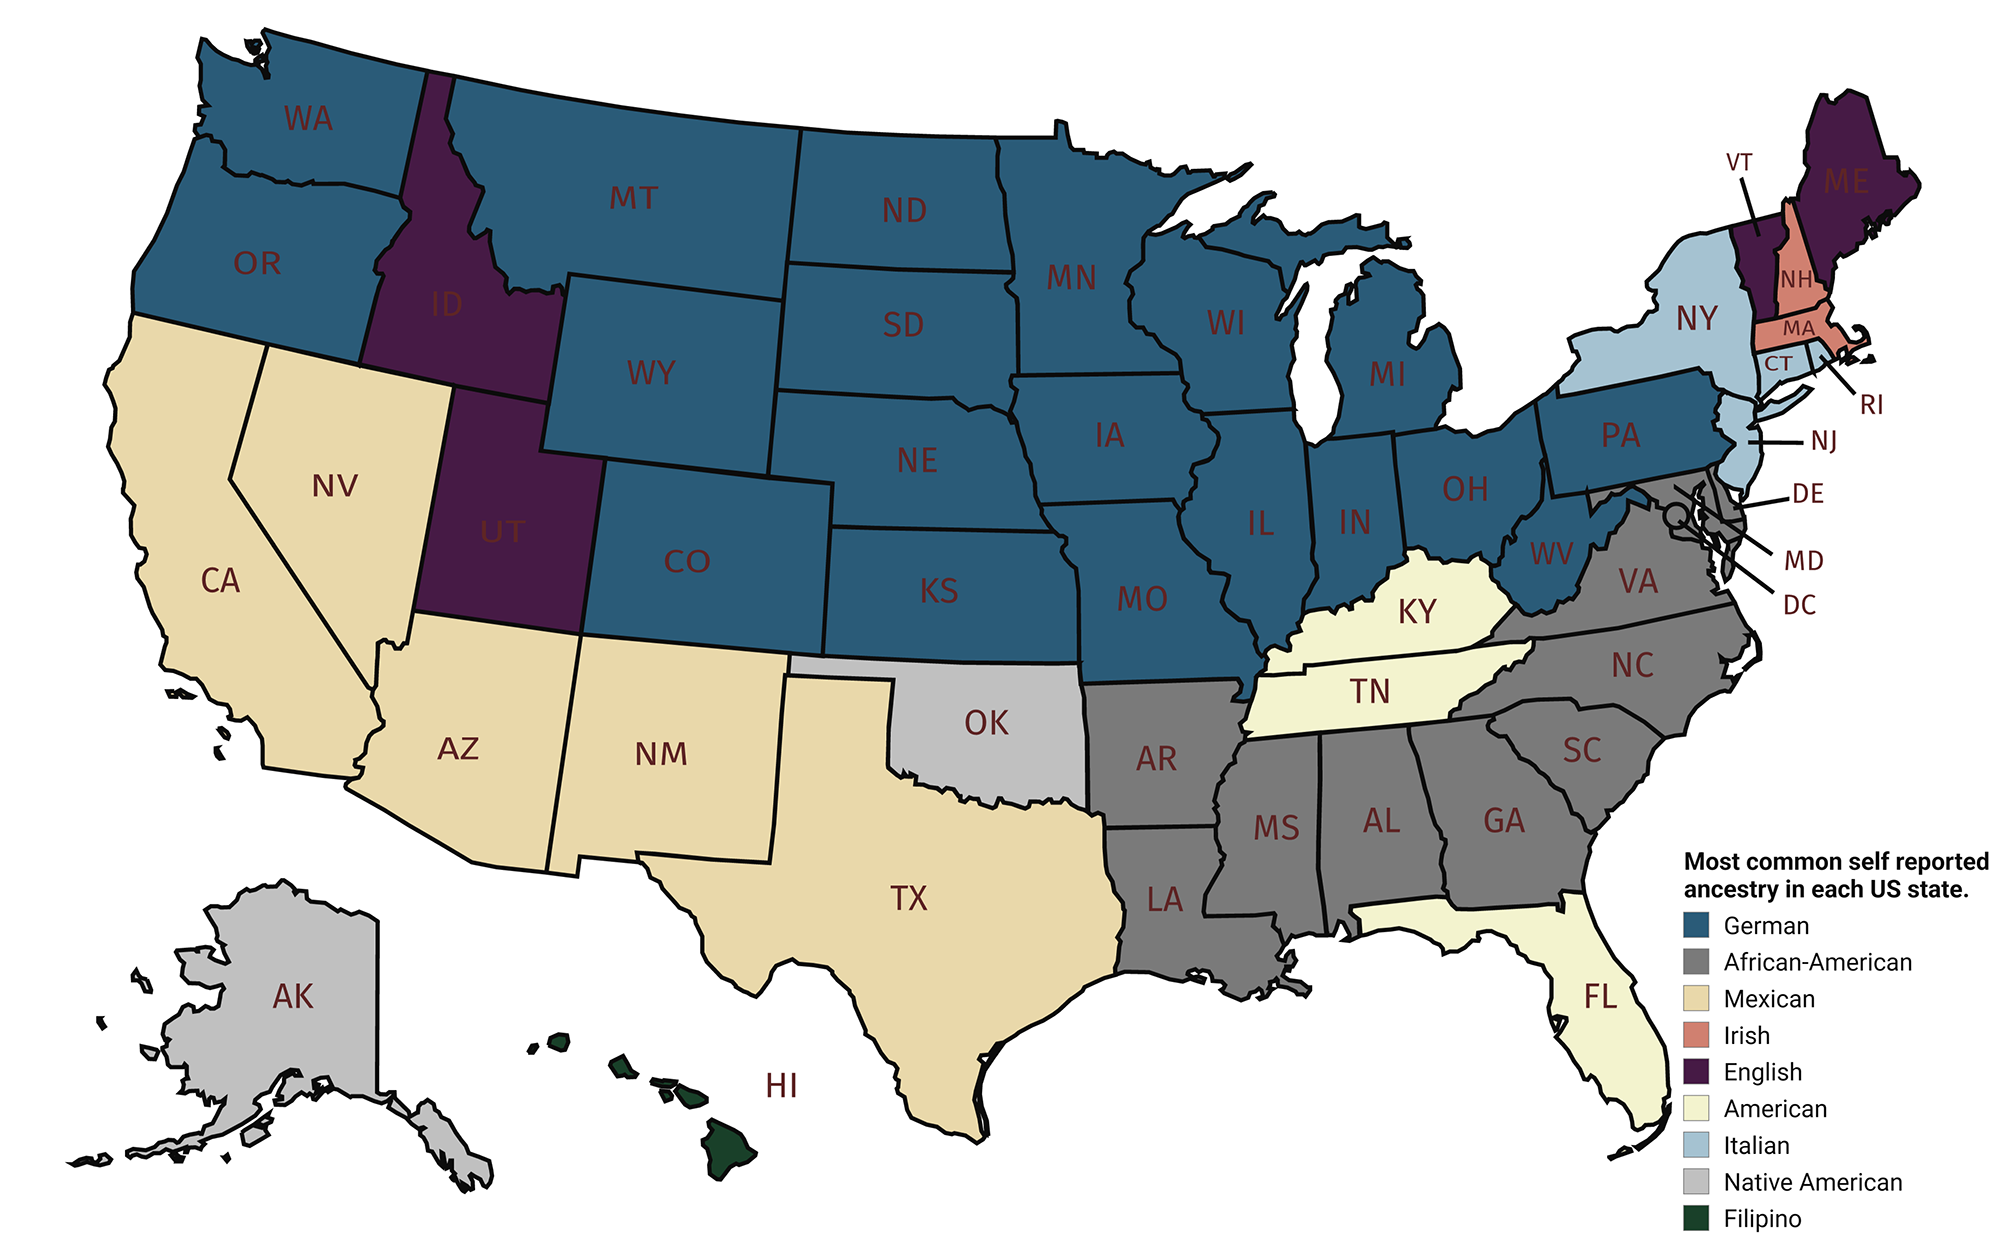
The maps below, created by a Reddit user, die_a_third_death show the largest Asian ancestry group in the U.S. by State and County.
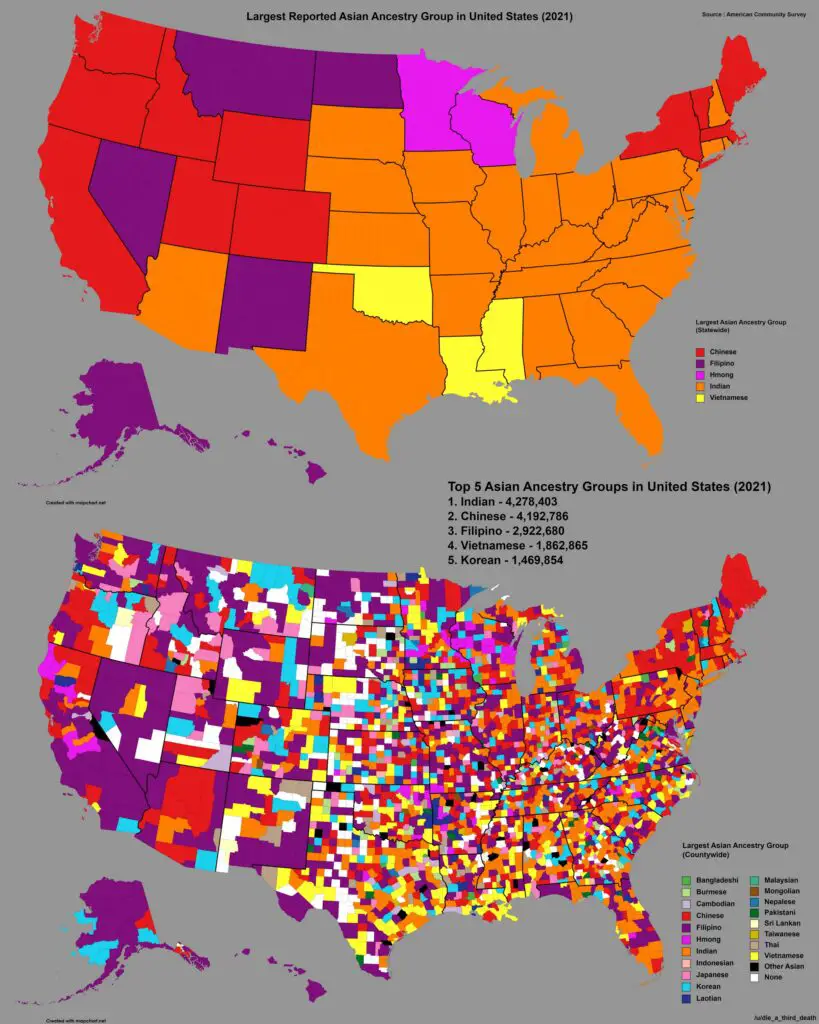
Indian, Chinese, and Filipino Americans make up the most significant percentage of the Asian American population, with 4.3 million, 4.2 million, and 2.9 million people, correspondingly. These numbers equal 23%, 20%, and 18% of the Asian American population, or 1.5% and 1.2% of the total American population.





I am surprised that on the county map, Sweden didn’t dominate. NE/KS alone has several. It was a self reported survey, though.
Africa is an entire continent whereas most of the other groupings are by nation/country.
this is really important!! but its also hard for a lot african americans to really know/track what their ethnicity is without a DNA test because their ancestors weren’t really recorded because they were mercilessly enslaved and taken away from their home nation
African-American really is a misnomer because the vast majority of AA are descended form African slaves who came to America several hundred years and don’t really identity with Africa at all. Yet, African Americans are a coherent, ethnic group with their own traditions, heritage, cultural artifacts and institutions, etc. because they had a separate society that was similar but parallel to the society of European Americans.
This actually blows my mind, but also makes sense. My county in Tennessee is labeled for most Mexican ancestry, and there are a ton of Latin descendants here, but I never realized their population was larger than the rest.
so, is this one EXCLUSIVE origin? meaning, one only claimed? because that significantly skews the map, either way, yes or no.
ridiculous to only have certain Latin American countries listed but LEAVE OUT SPAIN? really stupid, since millions of Americans’ ancestors, came direct from Spain hundreds of years ago, did not pass Go, ie,they never set foot in Mexico . such as , old families of the Gulf Coast for instance.
This map is based on self-classification so it can be supposed that those families assimilated into one of the other major groups.
“American” dominates Appalachia, and usually means Scots-Irish. Those people don’t know what to call themselves other than American. (My brother-in-law is almost purely Scots-Irish, yet had never heard that term before I asked him.)
That those counties show up as “Irish” or “English” reinforces this. Those would be the second-most prevalent there.
It’s also astonishing that “Scottish” doesn’t show up at all on the map. That’s a major ancestral source in this country, and might even be top in English Canada, which also sent many people to the US.
This is true. The result can only be distortion, and renders inaccurate an otherwise fascinating map if all are excluded who are not aware, are uncertain, or do not know what label should apply for their ethnic origins. For example, the majority of white Southerners, still the largest population group overall (but not in all counties) in the Southern states, as can be determined by cumulative census records are descendants of immigrants from some part of the British Isles, that is—various regions of England and especially Northern Ireland. It is from the latter region, most of whom who were Scots from the border areas with England, and who had been enticed to Ireland for administrative reasons of the Crown, who then later, in the 1700s, emigrated in large numbers to the American colonies. What were they to call themselves? As Protestants they did not consider themselves Irish; as of Scots heritage they did not consider themselves English. Furthermore, the term ‘British’, which might have sufficed but had not yet gained popular currency at the time of their departure, became a mark of abuse during the Revolution. They were happy to acquire a new name for themselves: Americans. Some way should be found to include all these people.
I think this map could be made better by grouping together regions by one colour or tones of one colour and maybe adding pattern, so for example, European countries could be tones of red possibly with a dot or hatch pattern. This may show clusters by regions more obvious.
The Germans sure cover a lot of real estate
mainly farmers with tons of land,and usually had huge families.
What I couldn’t wrap around my head a few years back when I just learnt that was that there are MORE Americans with GERMAN ancestry rather than ENGLISH ancestry.
As a European kid, since British and Americans speak the same language and have pretty much identical (not entirely though) names I kind of presumed that over 50% Americans must have British ancestry.
Nearly 80% of the white colonist army fighting England were German. PA was the only region of the colonies that was less than 50% English descent. Maybe why Ben Franklin wanted German to be the official language. Their typically numerous offspring began moving west and south within a single generation.
Just a quick note. Having grown up in Steubenville, Ohio, I noted many Italians who moved there to work in the steel mills in the early 1900’s. If you saw a telephone book of the 1950’s or 1960’s you would see there are many Italian names, but maybe not as many to alter you maps, but may be worth checking out. Thanks.