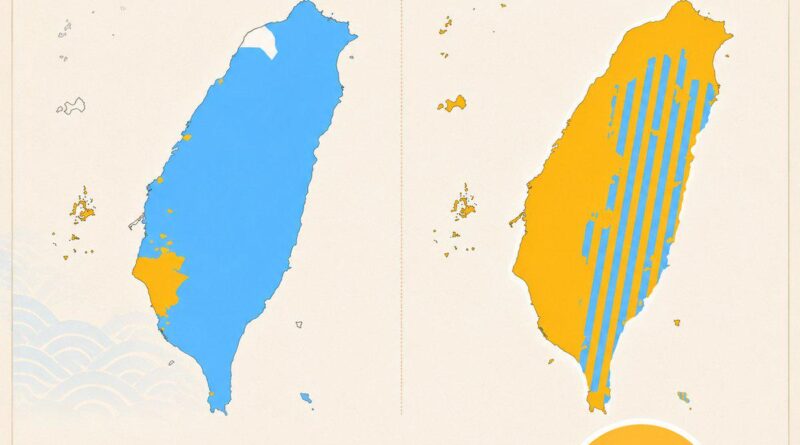
The World’s Three Largest Ethnic Groups and Where They Live
Three ethnic groups account for more than a quarter of everyone alive today.
Read MoreThree ethnic groups account for more than a quarter of everyone alive today.
Read MoreGermans dominate 21 states from Pennsylvania to Oregon. Forty-one million Americans identify as German, with Wisconsin at 36%. Mexicans lead five Southwest states at 11%. African Americans top nine Southern states where slavery was concentrated. Italians run New York, Connecticut, and New Jersey with 18 million Americans. Irish dominate New England at 11%.
Read MoreThese fascinating maps reveal where German, English, Irish, Italian and other European ancestry groups have settled across American counties, creating distinct regional patterns that persist generations later. Discover which European heritage dominates your region and the historical migration patterns that shaped America’s cultural geography.
Read MoreFrom Warsaw to Budapest, trace the ancestral origins of prominent Jewish American figures who transformed entertainment, technology, and finance. Their family journeys from Eastern Europe to America tell a remarkable story of innovation and achievement.
Read MoreJourney through three decades of America’s changing demographics with animated maps that reveal where different racial and ethnic groups form county majorities, telling the story of the nation’s increasing diversity.
Read MoreDiscover the changing geographic distribution of non-Hispanic white Americans through animated maps showing county-level population patterns from 1990 to 2022, revealing fascinating demographic shifts across the United States.
Read MoreA fascinating world map is shedding light on the diversity of national identities across the globe, highlighting the countries where no single ethnic group holds a majority.
Read MoreA detailed look at Native American population distribution across the United States, featuring custom-made maps that reveal concentration patterns from 1% to 90% and historical changes from 1990 to 2022. Based on comprehensive U.S. Census data analysis.
Read MoreThrough detailed animated maps based on U.S. Census data, we examine the geographic distribution of Asian Americans across U.S. counties, revealing dramatic population changes from 1990 to 2022 and identifying major demographic centers.
Read MoreThe United States is undergoing a profound demographic transformation, with Hispanic and Latino Americans playing an increasingly significant role in shaping the nation’s cultural and social landscape. Our latest maps offer a vivid portrayal of this demographic shift, illustrating the growing presence and influence of Hispanic and Latino communities across the country.
Read More