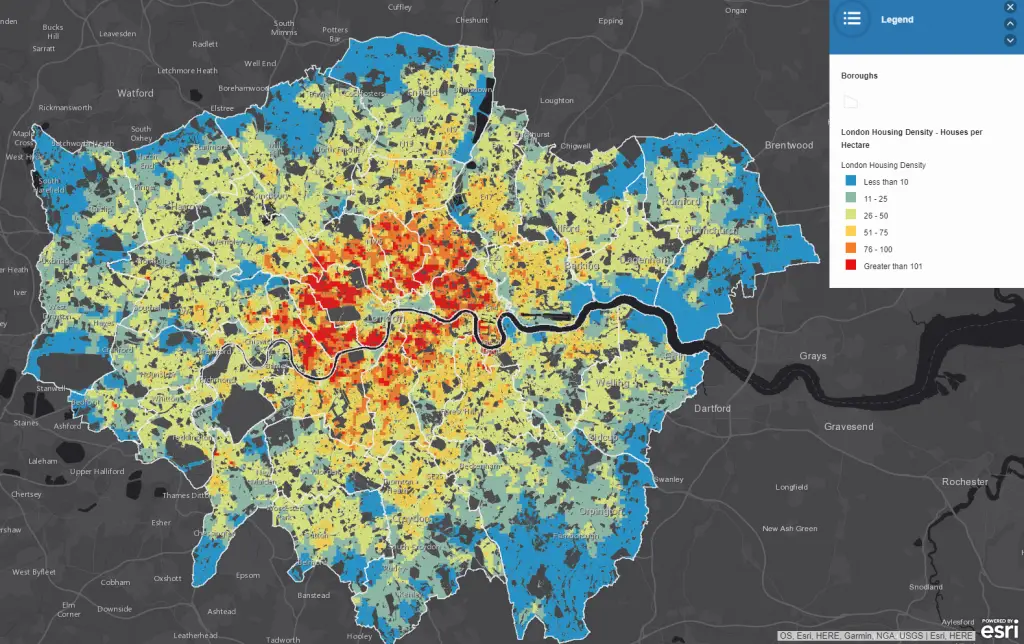
London Housing Density (Houses per Hectare)
This London housing density map has been created using 2015 LSOA housing data. The data records the number of homes in each LSOA, one building may contain multiple homes (e.g. a house converted into 4 flats will be recorded as 4 homes). A 200m x 200m grid has been created and any non-residential land use (e.g. parks, industrial areas, roads and functional sites such as hospitals) has been removed (where possible). The houses are assumed to be evenly distributed across an LSOA (excluding the non-residential land use areas) and the proportional number of houses in each grid square has been calculated. The density is represented as the number of houses per hectare.
Use the buttons to the left to turn additional layers on or off, change their opacity, change the base map and to view the legend. The building heights layer shows the height of buildings with known non-residential buildings (e.g. schools and hospitals) removed. Building volume has been calculated by multiplying the area of each building footprint with the average height, this has then been aggregated up to grid level.
Caveats:
Non-residential land use has been removed where possible, by using Open Street Map land use data and Ordnance Survey Open Map Functional Sites, Woodland and Surface Water datasets. This by no means removes all of the non-residential areas and some still remain in the dataset.
The building outlines in the London Residential Building Heights layer come from Ordnance Survey Open Map and are generalized boundaries, not individual buildings. Height data has been extracted from Environment Agency LIDAR data to record the maximum height seen in each building. The data has varied temporal coverage and so some newer developments may not be captured in the height data.
The building volumes have been created by multiplying the area of the building by its average height. This assumes that all buildings are a cube shape and other variations are not considered. This is likely to overrepresent volumes but this is uniform across the whole of London.
Created by Emu Analytics (www.emu-analytics.com).


