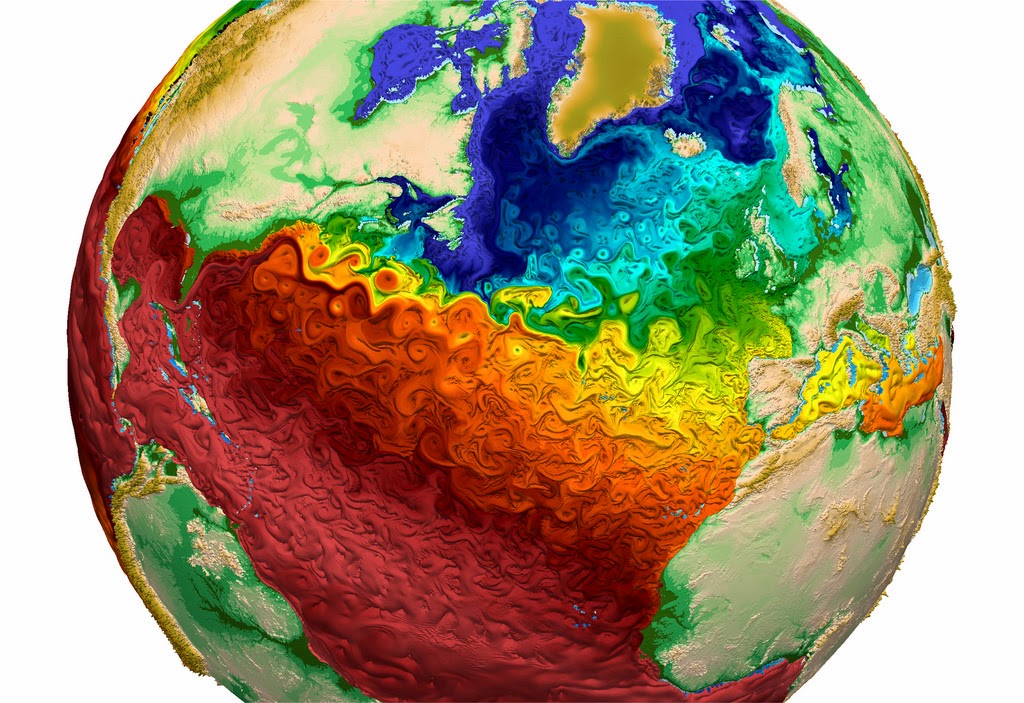
The paint-like swirls of this visualization from Los Alamos National Laboratory depict global water-surface temperatures, with the surface texture driven by vorticity. Cool temperatures are designated by blues and warmer temperatures by reds. Trapped regions of warmer water (red) adjacent to the Gulf Stream off the eastern coast of the U.S. indicate the model’s capability to simulate eddy transport of heat within the ocean, a key component necessary to accurately simulate global climate change.
?")


