Obesity prevalence in the United States
Obesity is a condition caused by a rise in the size and quantity of fat cells in the human body. The Centers for disease control and prevention (CDC) determines an adult with a body mass index of 30, or greater is obese.
Obesity in the U.S. is a significant health problem following various diseases diabetes, stroke, coronary artery disease ext. Obesity is contributing factor to about 112 thousand deaths in the U.S. per year.
Table of Contents
Symptoms of the obesity
Body mass index is often practiced to diagnose obesity. To determine Body mass index, divide weight in kg by height in meters squared or multiply weight in pounds by 703, divide by height in inches, and divide again by height in inches.
| Body mass index | Body mass |
|---|---|
| ≤ 18.5 | Underweight |
| 18.5 … 24.9 | Normal |
| 25.0 … 29.9 | Overweight |
| 30.0 ≥ | Obesity |
The obesity rate in the past
The preponderance of obesity in the U.S. has increased slowly over the past few decades.
The obesity rate has steadily increased since the initial 1962. According to the CDC obesity average in the United States was 12% in 1990. About 43% of U.S. adults were obese in 2018. From 2000 through 2018, U.S. obesity prevalence increased from 31% to 43%.
The map below shows how much the percentage of obese people has changed since 1990.

Obesity prevalence in the U.S. by state
According to CDC, all U.S. states had more than twenty percent of adult Americans with obesity. The Midwest (34%) and South (33%) had the highest predominance of obesity, accompanied by the Northeast (29%) and the West (27%).
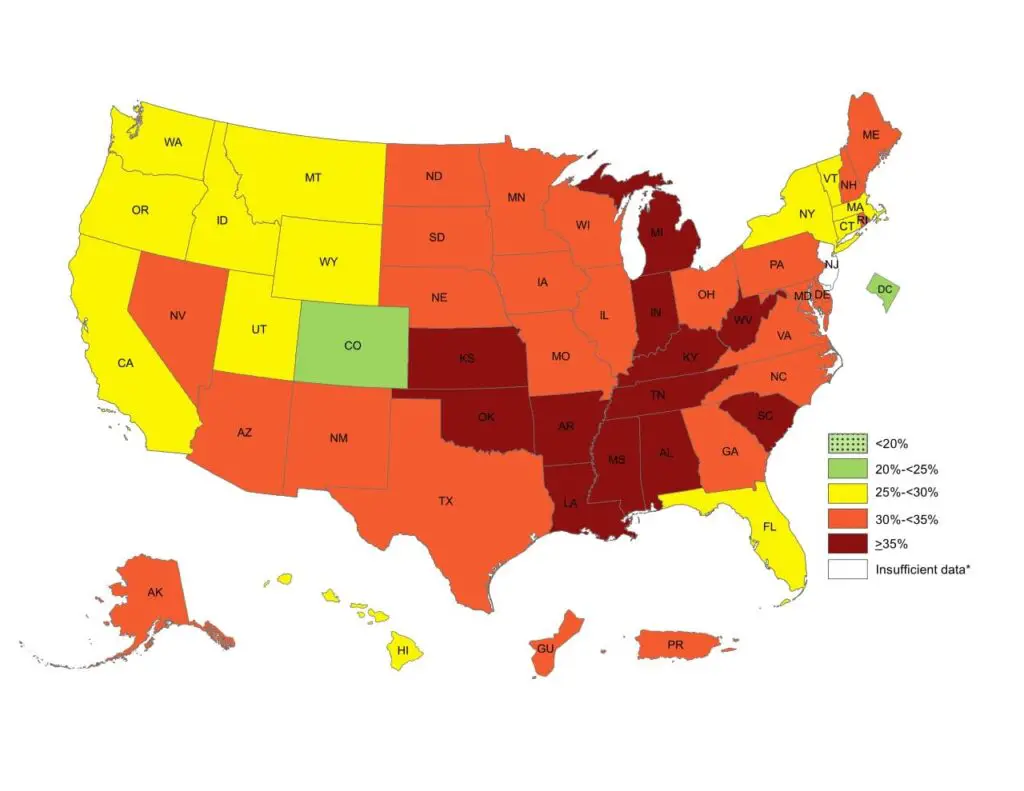
Six U.S. states had an obesity predominance of 35% or higher among non-Hispanic White adults. At the same time, fifteen U.S. states had an obesity predominance of 35% or higher among Hispanic adults.
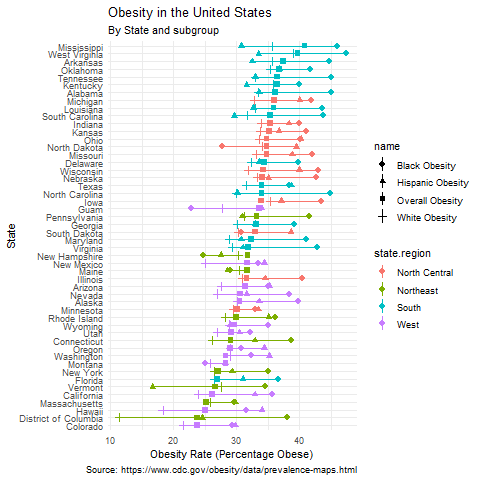
Black Americans have the highest obesity rate of any major racial group in the United States. Thirty-four U.S. states and D.C. had an obesity predominance of 35% or more prominent among non-Hispanic Black adults.
The graph below created by Reddit user whatweshouldcallyou clearly shows the differences in obesity rates between different ethnic groups.
The map below shows obesity prevalence in the United States by county.
Obesity prevalence in the U.S. by county
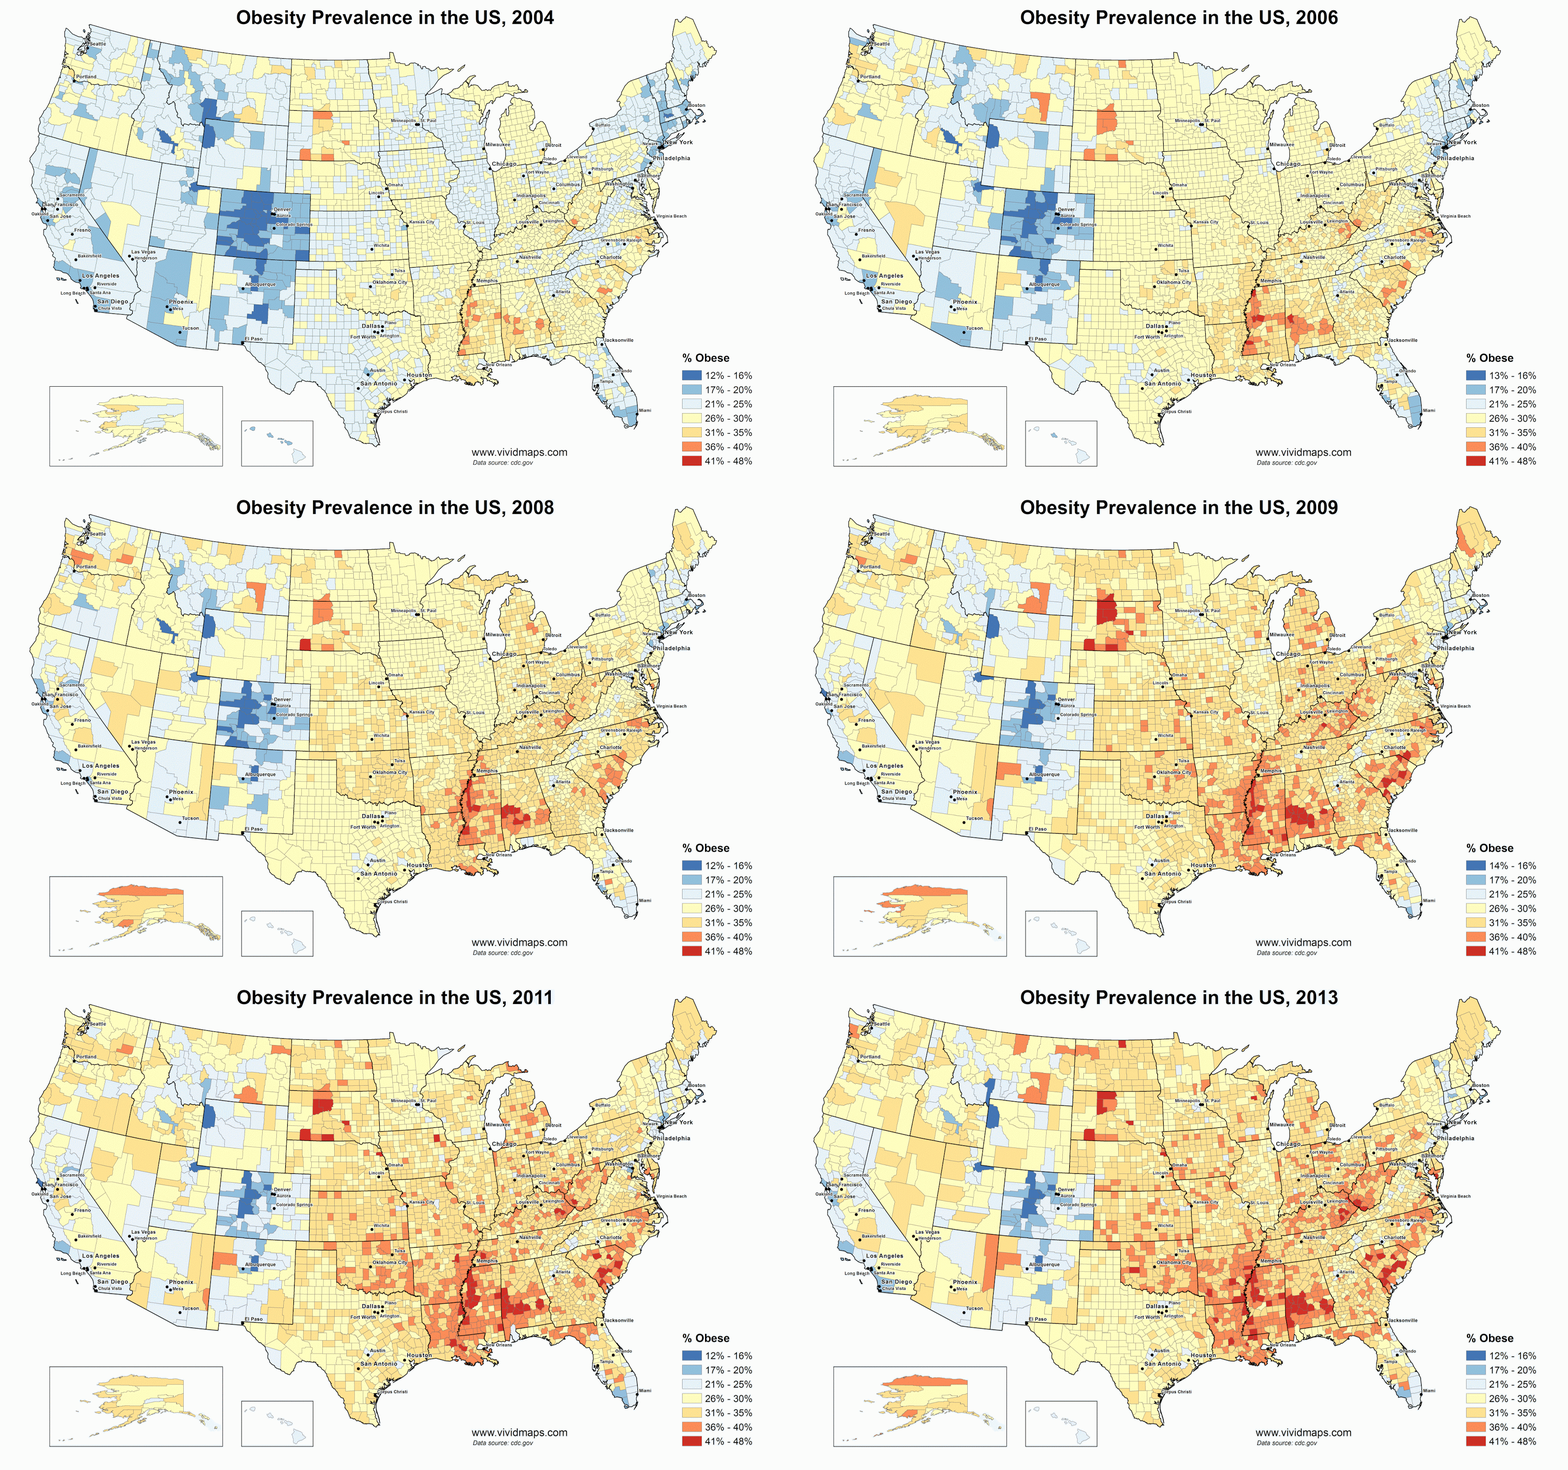
The animated map clearly shows, the uncontrolled obesity epidemic stroke the Mississippi with 1/3 of adults considered obese. Mississippi is the fattest state and getting fatter. The obesity epidemic is spreading further from Mississippi.
Forecasting future trends in obesity across the United States
According to Choice Project, the intense increase of obesity in the states began in the 2000s and reached a maximum speed in the 2010s. The map below Obesity prevalence in the U.S. by state from 1990 to 2030.
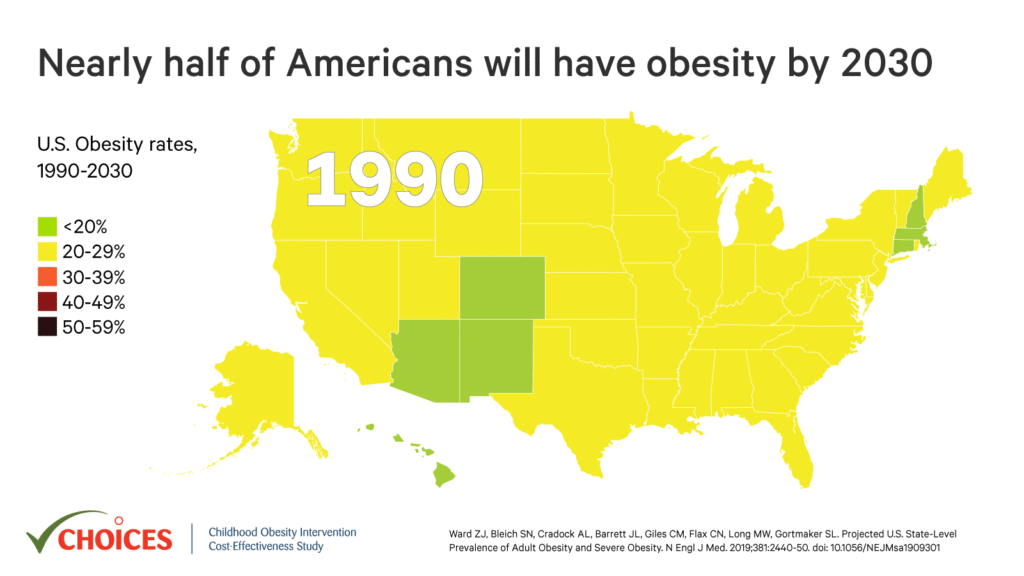
Choice Project forecasted about half of Americans will have obesity by 2030.

Obesity prevention for adults
Obesity, except for personal genetic causes, has environmental, lifestyle, socioeconomic, including diet causes. Here are some tips to help you fight obesity.
- consume less “bad” fat and more healthy (polyunsaturated) dietary fats
- eat less sugary and processed foods
- consume more portions of fruits and vegetables
- focus on eating lots of dietary fiber
- сhoose foods with the low–glycemic index
- engage in regular aerobic and weight training exercises
- try to reduce everyday stress


