Obesity rates worldwide
Obesity is most typically calculated using the body mass index scale. The World Health Organization defines body mass index as: “a simple index of weight-for-height that is usually used to classify underweight, overweight and obesity in adults.
The body mass index (BMI) may be defined using a table or chart which displays BMI as a function of mass and height using contour color lines or colors for different body mass index categories. You can also use a special calculator to calculate the index.
As a result, the body mass index allows broadly classifying a person as underweight, normal weight, overweight, or obese based on tissue mass (muscle, fat, and bone) and height.
| Category | BMI (kg/m2) |
|---|---|
| Underweight (Severe thinness) | < 16.0 |
| Underweight (Moderate thinness) | 16.0 – 16.9 |
| Underweight (Mild thinness) | 17.0 – 18.4 |
| Normal range | 18.5 – 24.9 |
| Overweight (Pre-obese) | 25.0 – 29.9 |
| Obese (Class I) | 30.0 – 34.9 |
| Obese (Class II) | 35.0 – 39.9 |
| Obese (Class III) | ≥ 40.0 |
According to World Health Organization, Worldwide obesity has almost tripled since 1975. As a result, in 2016, nearly 1.9 billion adults were overweight, 39 million kids under the age of 5 were overweight or obese in 2020.
The world map below shows the body mass index by country in 2020. The green color shows countries whose residents, on average, have normal weight, while the orange indicates countries whose residents are overweight.

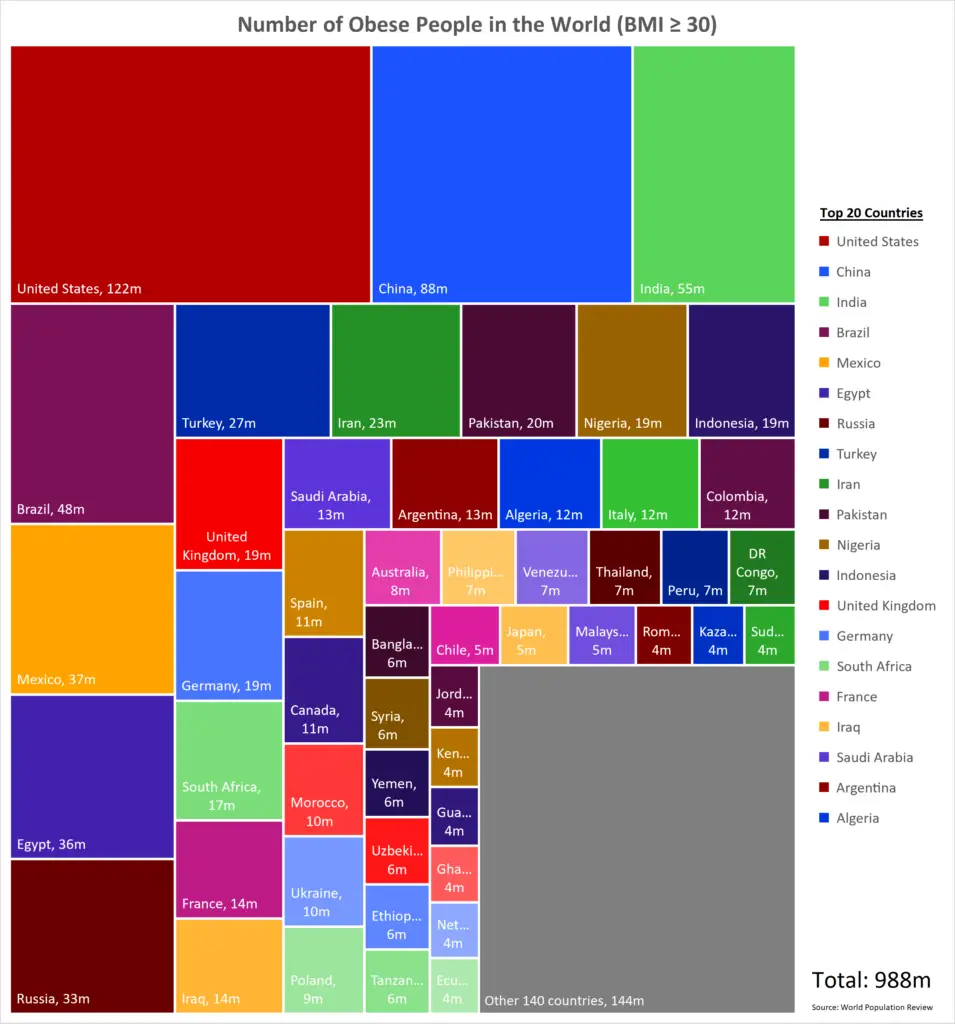
Number of Obese People in the World (BMI ≥ 30)
The United States has the highest number of obese people (122 million). With four times the population of the United States, China has the second highest number of obese people (88 million). Below is the graph of the number of obese people worldwide with a Body Mass Index equal to or greater than 30 created by Reddit user flyingcatwithhorns.
Top 10 most obese countries in the world by average BMI
| Rank | Country | Average BMI |
|---|---|---|
| 1 | Cook Islands | 32.9 |
| 2 | Nauru | 32.5 |
| 3 | Niue | 32.4 |
| 4 | Samoa | 32.2 |
| 5 | Tonga | 32.2 |
| 6 | Tuvalu | 30.8 |
| 7 | Kiribati | 30.1 |
| 8 | Saint Lucia | 30 |
| 9 | Micronesia | 29.7 |
| 10 | Egypt | 29.6 |
Top 10 most obese countries by percentage of obese adults
| Rank | Country | Percentage of obese adults |
|---|---|---|
| 1 | Nauru | 61 |
| 2 | Cook Islands | 55.9 |
| 3 | Palau | 55.3 |
| 4 | Marshall Islands | 52.9 |
| 5 | Tuvalu | 51.6 |
| 6 | Niue | 50 |
| 7 | Tonga | 48.2 |
| 8 | Samoa | 47.3 |
| 9 | Kiribati | 46 |
| 10 | Micronesia | 45.8 |
People in developing countries are the least overweight.
Top 10 least obese countries in the world
| Rank | Country | Average BMI |
|---|---|---|
| 1 | Madagascar | 21.1 |
| 2 | Eritrea | 21.1 |
| 3 | Ethiopia | 21.1 |
| 4 | Timor Leste | 21.3 |
| 5 | Burundi | 21.6 |
| 6 | Japan | 21.8 |
| 7 | Chad | 21.9 |
| 8 | India | 21.9 |
| 9 | Bangladesh | 22 |
| 10 | Burkina Faso | 22.1 |
Between 1975 and 2014, obesity rates increased from 3.2% to 10.8% for men and from 6.4% to 14.9% for women.

If the post-2000 trends continue, by 2025, it projects a worldwide obesity rate of 18% for men and 21% for women.


