According to the 2020 U.S. Religion Census (carried out by the Association of Statisticians of American Religious Bodies and archived at ARDA), there were 356,642 congregations and 161,224,088 adherents across the United States — roughly 48.6% of the population at that time.
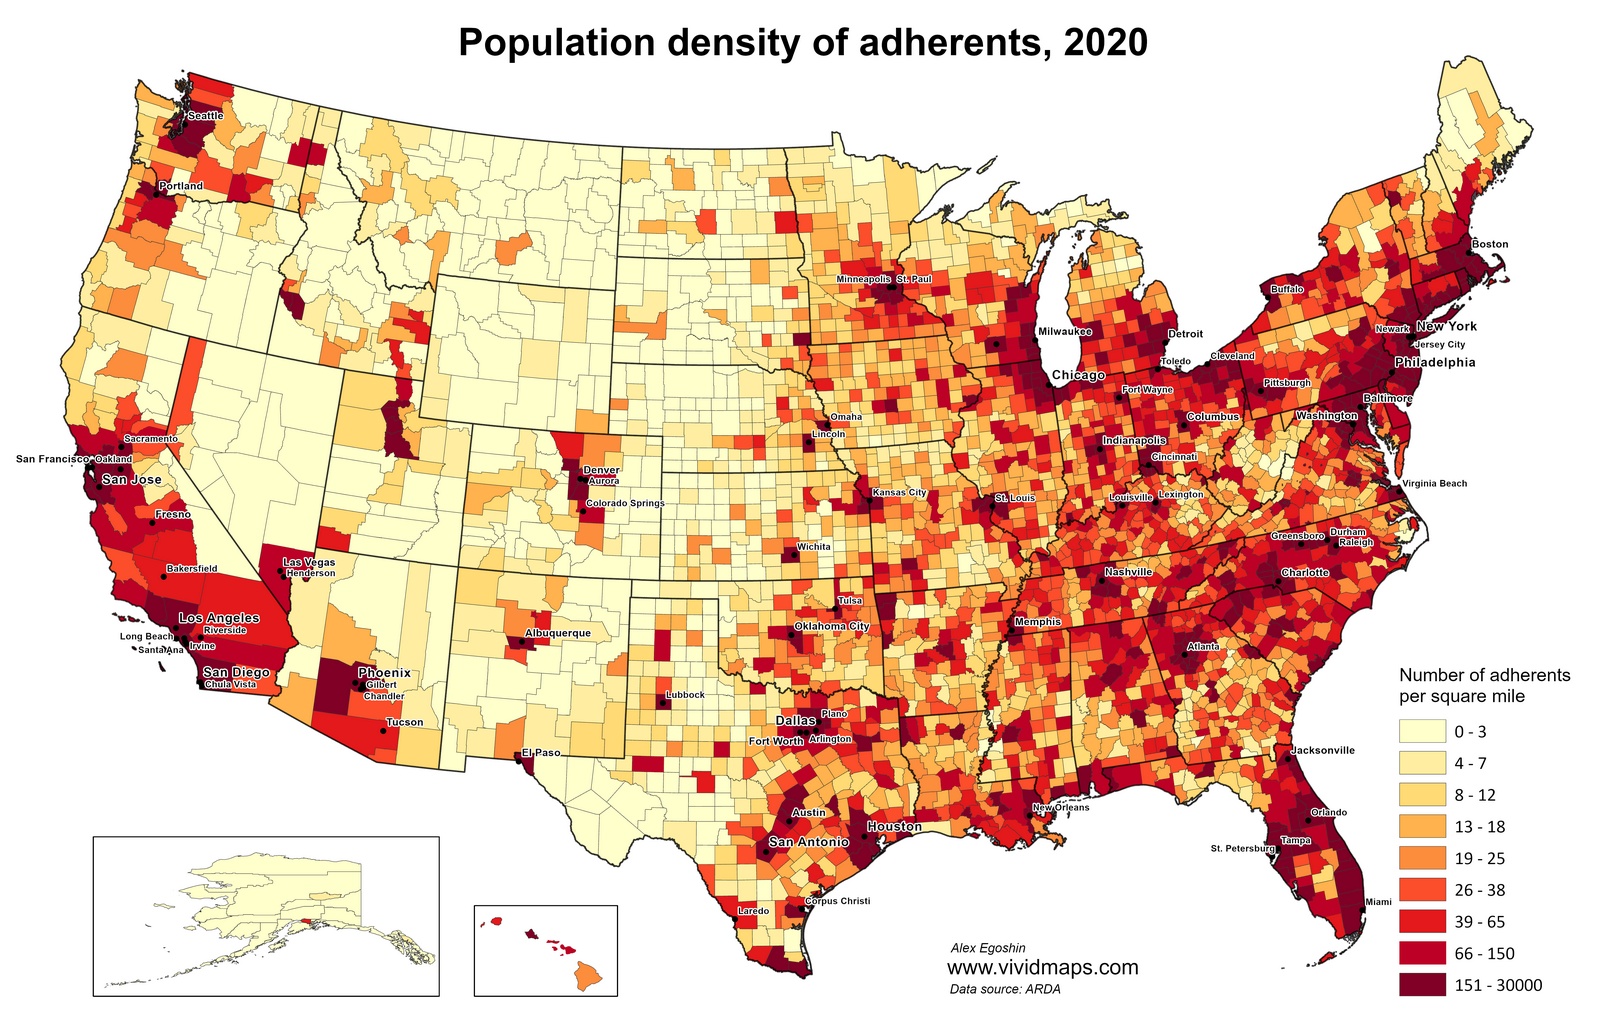
To make those numbers easier to picture, I used ARDA data to create a map showing the number of religious adherents per square mile in each county. In my opinion, the result is a kind of population-density map — but instead of counting everyone, it only counts people linked to congregations.
Looking at the map, counties in the Deep South, parts of Texas, Florida, and the Midwest come out darkest, meaning the most adherents per square mile. Many counties in the Mountain West and other rural western regions are much lighter because of low population density rather than an absence of religious people.
Urban areas like Los Angeles County, Cook County (Chicago), and Miami-Dade still show dark shades because they have both high population and many adherents.
I also made an animated version spanning 1890 to 2020, which shows how adherent density has shifted as the country’s population and congregations grew and spread over time.


")