The Atlas of ReUrbanism
The Atlas of ReUrbanism is a tool to understand, support, and transform American cities. Developed by the Preservation Green Lab, the Atlas of Rellrbanism takes the massive amount of data available about the built environment of cities and provides a platform to explore the connections between buildings and various economic, social, and environmental outcomes. Whether you’re an activist, journalist, developer, or resident, the Atlas of ReUrbanism contains detailed information about the businesses and residents, buildings and blocks in urban neighborhoods across the country.
On this map, you can:
– Learn about how buildings and blocks contribute to your neighborhood
– See what the ‘Character Score’ looks like where you live and work
– Explore variations in the density of people and jobs across your city
– Identify concentrations of architecturally and historically significant buildings, monuments, and sites
– Analyze the performance of buildings and blocks in your favorite and least favorite commercial corridors
– Determine where buildings may be underutilized or underperforming
The Preservation Green Lab believes older buildings and blocks are inherently sustainable, helping reach positive environmental, economic, and social outcomes in cities and towns across the country. With staff in Seattle, Denver, New York, and Washington DC, the Green Lab conducts research and delivers tools to demonstrate the important role played by older buildings and blocks, advocate for building reuse to be a more attractive development strategy, contribute to the conversation on climate change and historic resources, and support efforts to make older buildings more energy efficient.
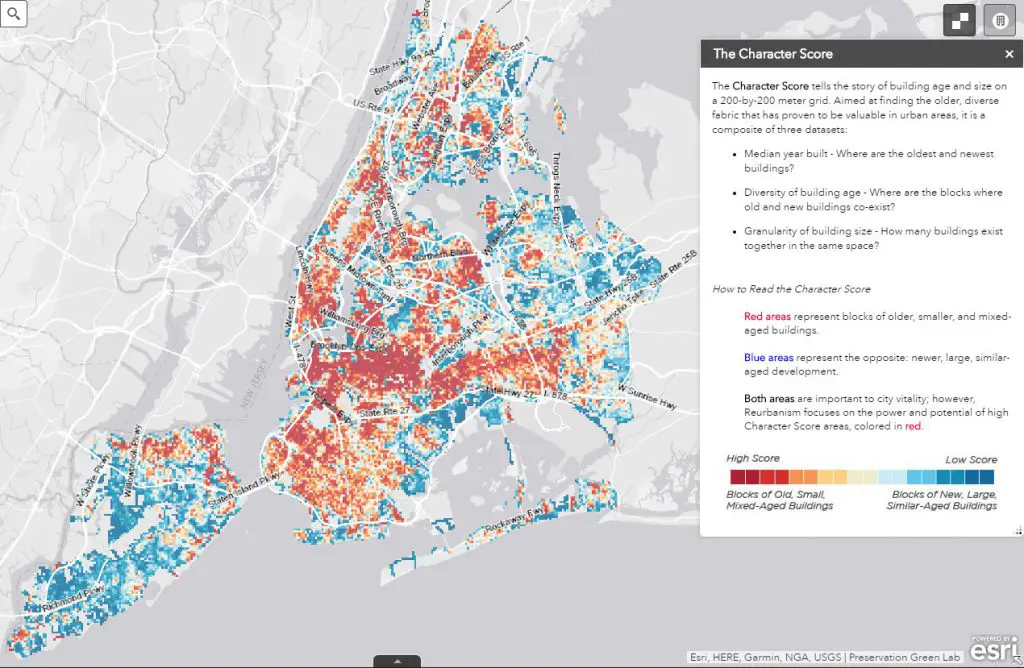
Red areas represent blocks of older, smaller, mixed-aged buildings. Blue areas represent the opposite: newer, larger, similar-aged development.
The Character Score tells the story of building age and size on a 200-by-200 meter grid. Aimed at finding the older, diverse fabric that has proven to be valuable in urban areas, it is a composite of three datasets:
• Median year built – Where are the oldest and newest buildings?
• Diversity of building age – Where are the blocks where old and new buildings co-exist?
• Granularity of building size – How many buildings exist together in the same space?


