Acquiring a home stands as a significant financial milestone. Information from the U.S. Census Bureau reveals a nationwide homeownership rate of 64.8%, signaling a gradual turnaround from the downward trend that began in 2004. However, despite these recent improvements, homeownership remains an elusive goal for numerous individuals. A primary factor contributing to this challenge is the lack of alignment between income levels and the escalating costs of homes, leaving many people unable to enter the real estate market.
The typical home in the United States is priced at approximately $257,600. To afford this with a 20 percent down payment, a 4.90 percent mortgage rate, and factoring in expenses for principal, interest, taxes, and insurance, a potential buyer would require a salary of $61,453.51.
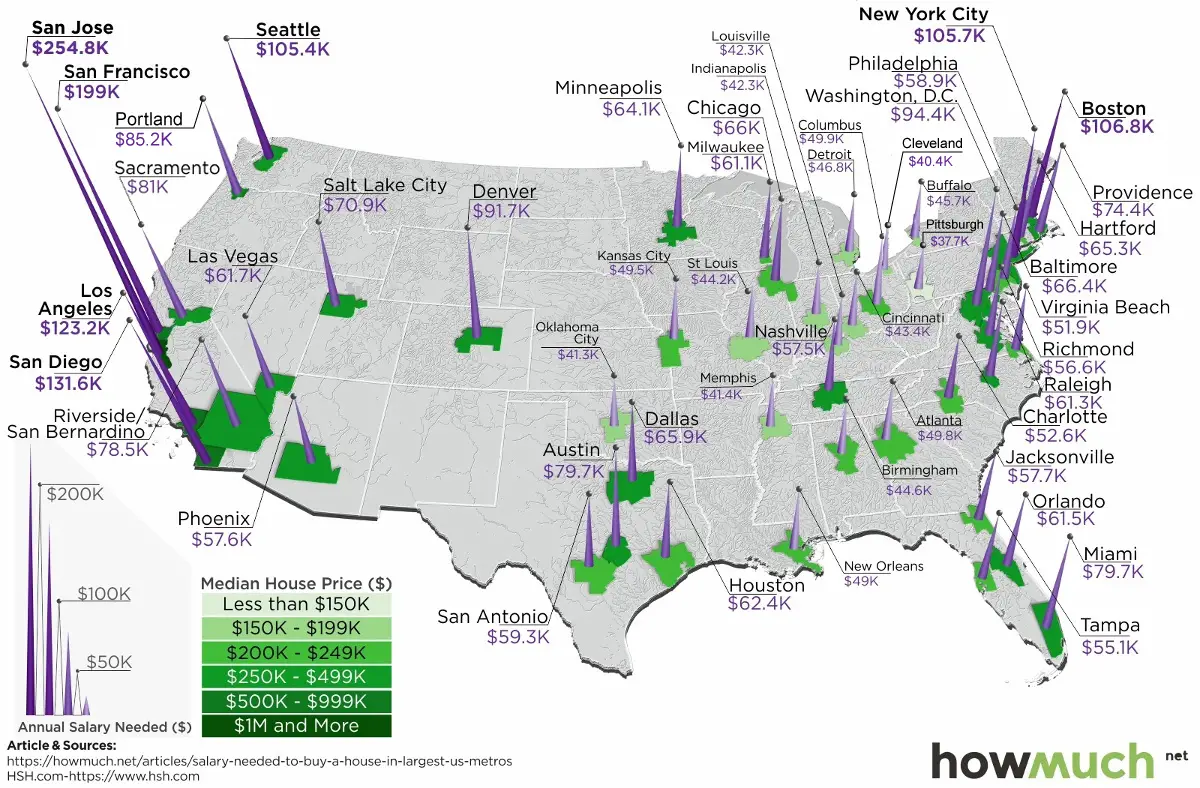
In general, metropolitan areas in the Midwest and the South require lower salaries compared to their counterparts on the West Coast and the East Coast.
The costliest urban areas are mainly located in California, especially in and around Silicon Valley. For instance, San Jose demands the highest salary ($254,835.73) for a median-priced home, followed by San Francisco, requiring the second-highest salary ($198,978.01).
Metropolitan areas in the Northeast, such as Boston ($106,789.93) and New York ($105,684.33), also exhibit similar high costs.
Conversely, Pittsburgh only mandates a salary of $37,659.86 to purchase a median-priced home. Metropolitan areas such as Memphis and Oklahoma City require only one-sixth of the salary needed in San Jose.
According to HSH Associates, one would need to earn $61,453 to afford a home in the US. However, in 24 out of the largest 50 metro areas, a higher salary is required to make homeownership affordable. It’s essential to note that even within metro areas, home prices and salaries can vary by zip
The ten most expensive metro areas with the highest salary required for buying a home
San Jose – $254,835.73
San Francisco – $198,978.01
San Diego – $131,640.79
Los Angeles – $123,156.01
Boston – $106,789.93
New York City – $105,684.33
Seattle $489,600 – $105,367.89
Washington, D.C. – $94,408.70
Denver – $91,672.45
Portland – $85,173.08
The ten cheapest metro areas with the lowest salary required for buying a home
Pittsburgh – $37,659.86
Cleveland – $40,437.72
Oklahoma City – $41,335.41
Memphis – $41,400.93
Indianapolis – $42,288.92
Louisville – $42,323.15
Cincinnati – $43,429.97
St. Louis – $44,215.56
Birmingham – $44,593.35
Buffalo – $45,698.05
The salary you must earn to buy a home in the 50 largest metros.


One chart I wish Boston didn’t score high on…
Interesting, but I think someone confused Charlottesville with Charlotte.