How America’s Climate Zones Are Shifting
The United States spans an extraordinary range of climates. You can find Arctic tundra in northern Alaska, steamy subtropical forests in Florida, bone-dry deserts in Nevada, Mediterranean valleys in California, and cool maritime rainforests along the Pacific Northwest coast. Few countries on Earth pack such climatic variety into their borders.
But how do we make sense of all this diversity? Average temperatures alone don’t capture the full picture. A place can have the same annual average temperature as another yet support completely different ecosystems depending on when rain falls, how severe winters get, or how long the growing season lasts. That’s where the Köppen–Geiger climate classification becomes invaluable. Developed over a century ago and refined ever since, it remains the most widely used system worldwide because it ties climate directly to what actually grows on the ground. Instead of just measuring averages, Köppen–Geiger groups places by temperature thresholds and seasonal precipitation patterns, which means the classification naturally aligns with vegetation zones and ecosystems.
For this post, I created a series of climate maps showing how these zones have moved across the United States over the past century and how they’re projected to shift by the end of this century. All the maps use high-resolution (1 kilometer) data from Beck et al. (2023), who combined historical climate records with downscaled projections from the latest generation of climate models. Their dataset provides consistent 30-year climate normals from 1901 all the way through 2099, making it possible to track changes across nearly two centuries.
Understanding the Climate Codes
Each Köppen–Geiger code has two or three letters: the first describes the general climate group (A = tropical, B = arid, C = temperate, D = cold/continental, E = polar), and the following letters add details about precipitation patterns and temperature extremes.
| Code | Short name | Description |
| Af | Tropical — rainforest | Warm and rainy year-round, with no dry season |
| Am | Tropical — monsoon | Warm with intense summer rains and a brief dry period |
| Aw | Tropical — savannah | Warm with distinct wet and dry seasons |
| BWh | Arid — desert (hot) | Very dry, hot deserts. |
| BWk | Arid — desert (cold) | Very dry deserts with cool or cold winters. |
| BSh | Arid — steppe (hot) | Semi-arid, generally hot. |
| BSk | Arid — steppe (cold) | Semi-arid with colder winters. |
| Csa | Temperate — dry summer, hot | Mediterranean: dry, hot summers; mild, wetter winters. |
| Csb | Temperate — dry summer, warm | Mediterranean with milder summers. |
| Csc | Temperate — dry summer, cool | Dry-summer climates at high elevation (rare). |
| Cwa | Temperate — dry winter, hot | Seasonal rainfall concentrated in warm months; dry winters. |
| Cwb | Temperate — dry winter, warm | Upland variant of Cwa with milder summers. |
| Cwc | Temperate — dry winter, cool | High-elevation cooler variant. |
| Cfa | Temperate — no dry season, hot | Humid subtropical — rainfall year-round, hot summers. |
| Cfb | Temperate — no dry season, warm | Oceanic — mild summers, year-round precipitation. |
| Cfc | Temperate — no dry season, cool | Cool oceanic climates. |
| Dsa | Cold — dry summer, hot | Continental with dry summers and hot peaks (rare). |
| Dsb | Cold — dry summer, warm | Continental with dry summers and warm summers. |
| Dsc | Cold — dry summer, cool | Cold continental with dry summers. |
| Dsd | Cold — dry summer, very cold | Very cold continental extremes. |
| Dwa | Cold — dry winter, hot | Monsoon-influenced continental with hot summers. |
| Dwb | Cold — dry winter, warm | Monsoon-influenced continental with warm summers. |
| Dwc | Cold — dry winter, cold | Subarctic with dry winters. |
| Dwd | Cold — dry winter, very cold | Extreme subarctic cold. |
| Dfa | Cold — no dry season, hot | Humid continental, hot summers. |
| Dfb | Cold — no dry season, warm | Humid continental, warm summers. |
| Dfc | Cold — no dry season, cool | Subarctic climates with short cool summers. |
| Dfd | Cold — no dry season, very cold | Very cold subarctic extremes. |
| ET | Polar — tundra | Warmest month 0–10 °C; tundra vegetation. |
| EF | Polar — frost | No month ≥ 0 °C — permanent frost. |
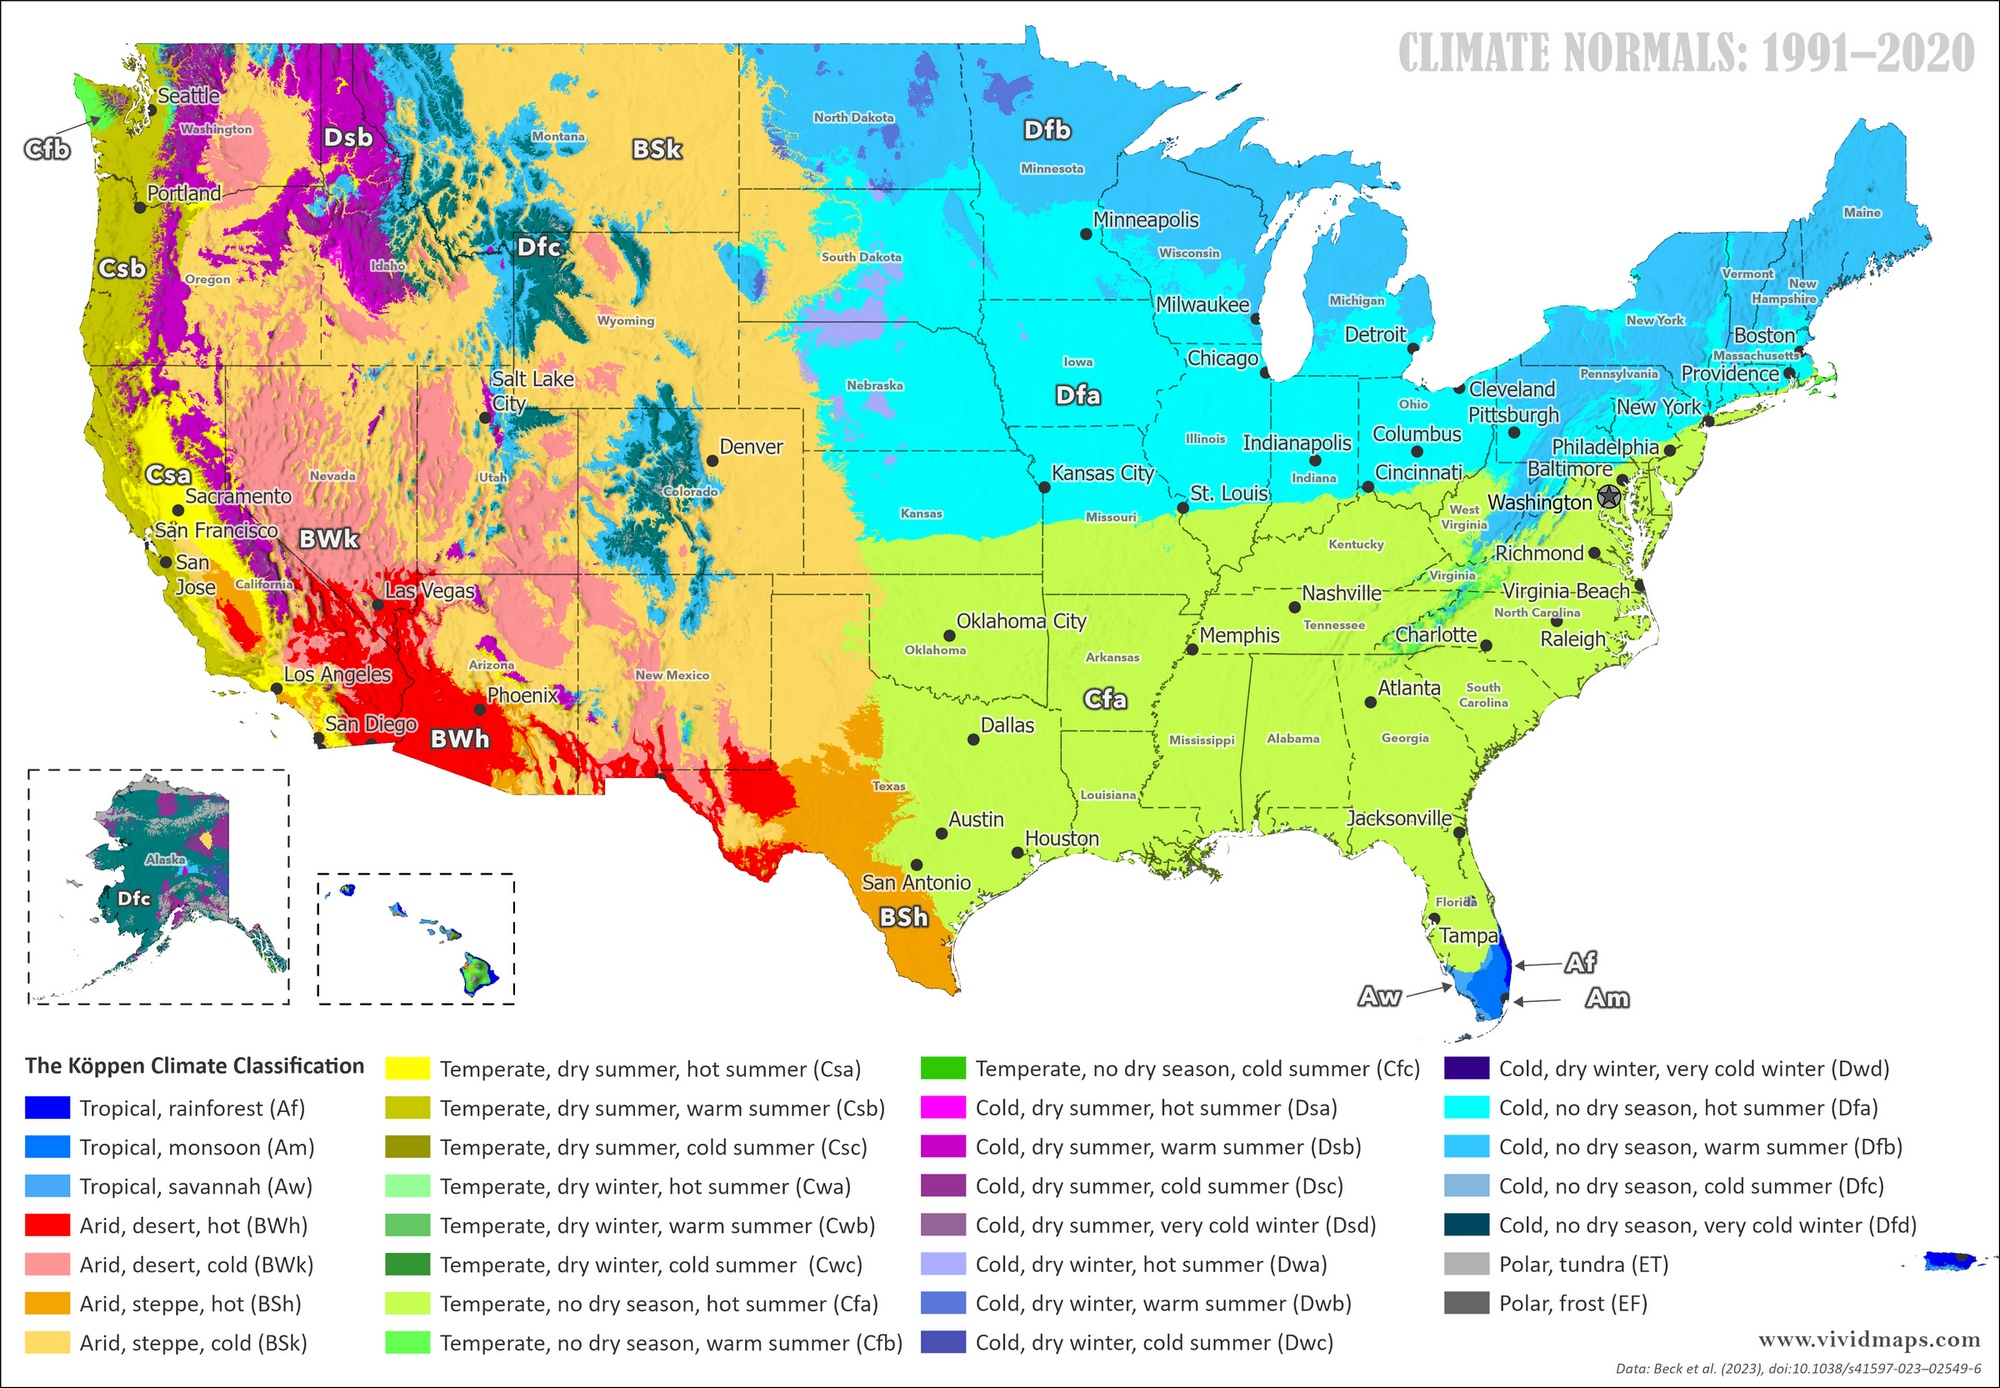
The Southeast of the United States is dominated by humid subtropical climate (Cfa in lime green), where hot summers and year-round rainfall support deciduous forests and intensive agriculture. Move to the north, and you will find regions with a climate where severe winter cold meets hot or warm summers (Dfa and Dfb in cyan and bright blue). The interior West displays a progression from semi-arid steppe (BSk in yellow) to true desert (BWk and BWh in reds and pinks) across rain-shadow basins where mountain ranges block Pacific moisture. California’s coast shows those distinctive Mediterranean strips (Csa and Csb in yellows) where summers stay dry and winters bring the rain. The Pacific Northwest features oceanic climate (Cfb in green) with mild temperatures and abundant year-round precipitation. Mountain ranges create narrow vertical bands of cooler climate types, compressing what would normally be hundreds of kilometers of latitudinal change into just a few kilometers of elevation. Alaska holds onto the polar and subarctic zones (ET, EF, Dfc, Dfd in grays and dark teals), the coldest climates found anywhere in the United States.
Looking Back: How Climate Zones Moved in the 20th Century
Climate isn’t static. When we compare the early 20th century (1901–1930) with the late 20th/early 21st century (1991–2020), shifts become visible. The polar and coldest continental zones have pulled back northward. Temperate zones have crept north into areas that were once colder. In parts of the interior West, arid and semi-arid zones have expanded as precipitation patterns changed and temperatures rose.
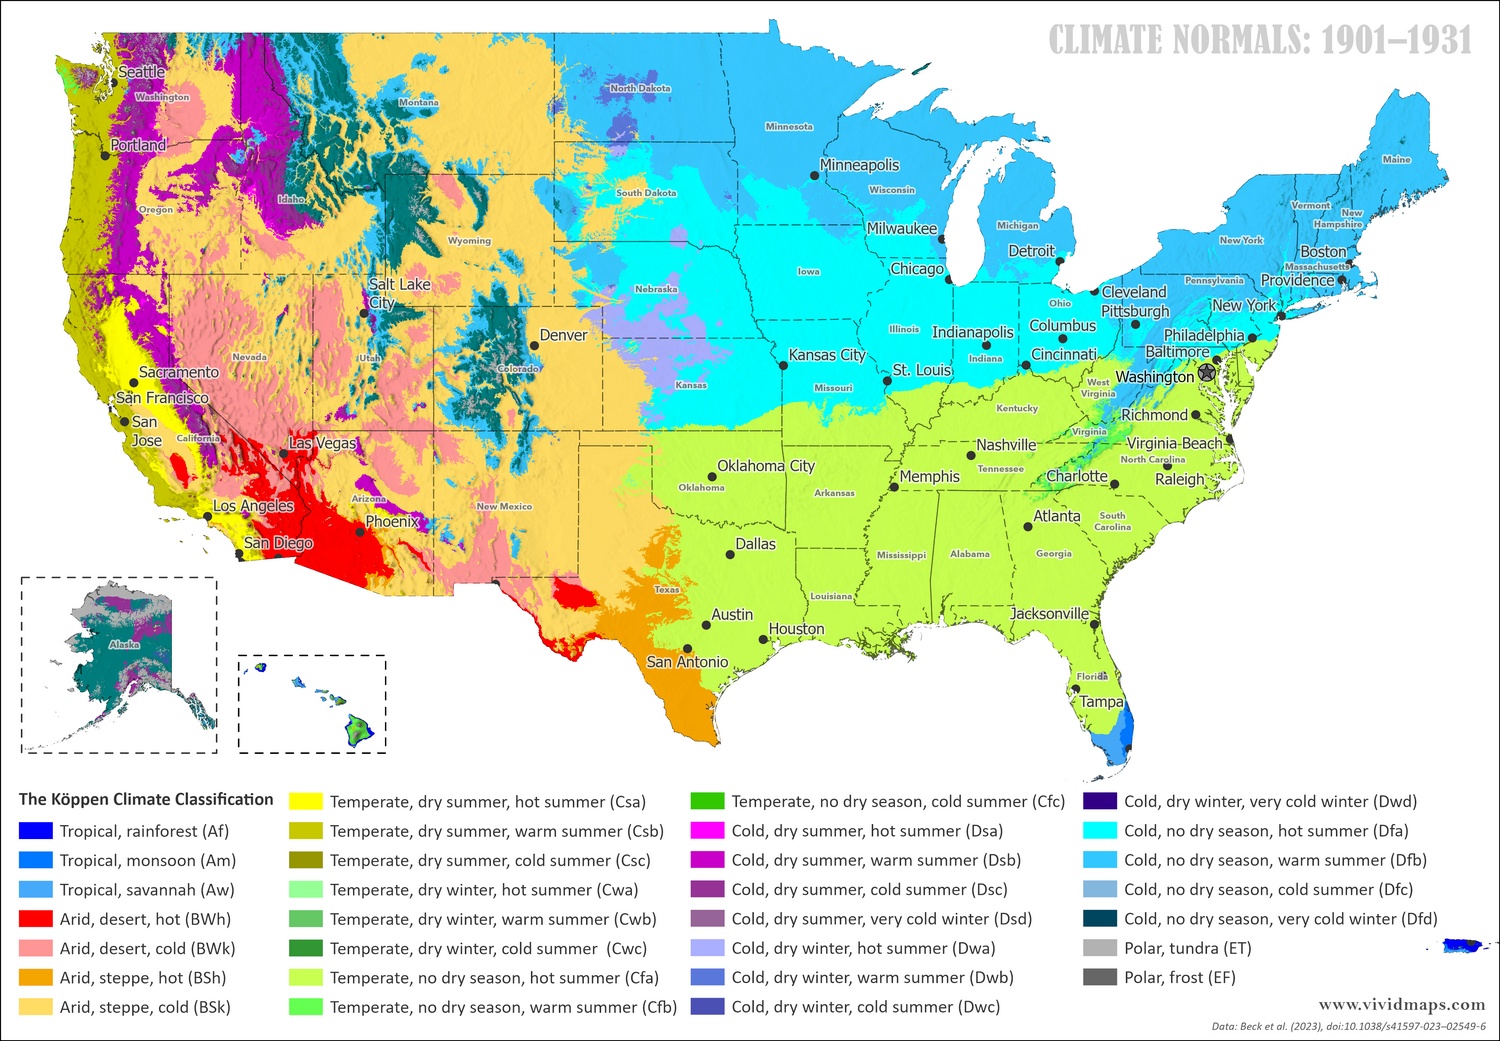
Comparing 1901–1930 with 1991–2020 climate zones.
Watch Alaska especially in this comparison. The tundra zones (ET in gray) have contracted, and subarctic zones (Dfc, Dfd) have shifted. In the northern Great Plains and upper Midwest, some of the coldest continental zones (Dfb, Dfc) have given ground to slightly warmer classifications. The Southeast has seen its humid subtropical zone expand slightly northward. The mountain West shows more localized changes, with some steppe zones becoming more arid and high-elevation zones warming enough to shift categories.
What Happens by Century’s End
Looking toward 2099 requires choosing a projection scenario. Climate scientists work with several possible futures depending on how emissions, technology, and global policy evolve over the coming decades. They call these Shared Socioeconomic Pathways, or SSPs. None of them are crystal-ball predictions. Instead, they’re frameworks that ask “what if this happens?”
For these maps, I used ssp2-4.5. It sits in the middle range: emissions keep rising for a few more decades, then level off as cleaner technology spreads and some climate policies take hold. It’s not the best-case scenario, but it’s not the worst either. Most researchers consider it a realistic reference point because it assumes neither rapid global transformation nor complete inaction.
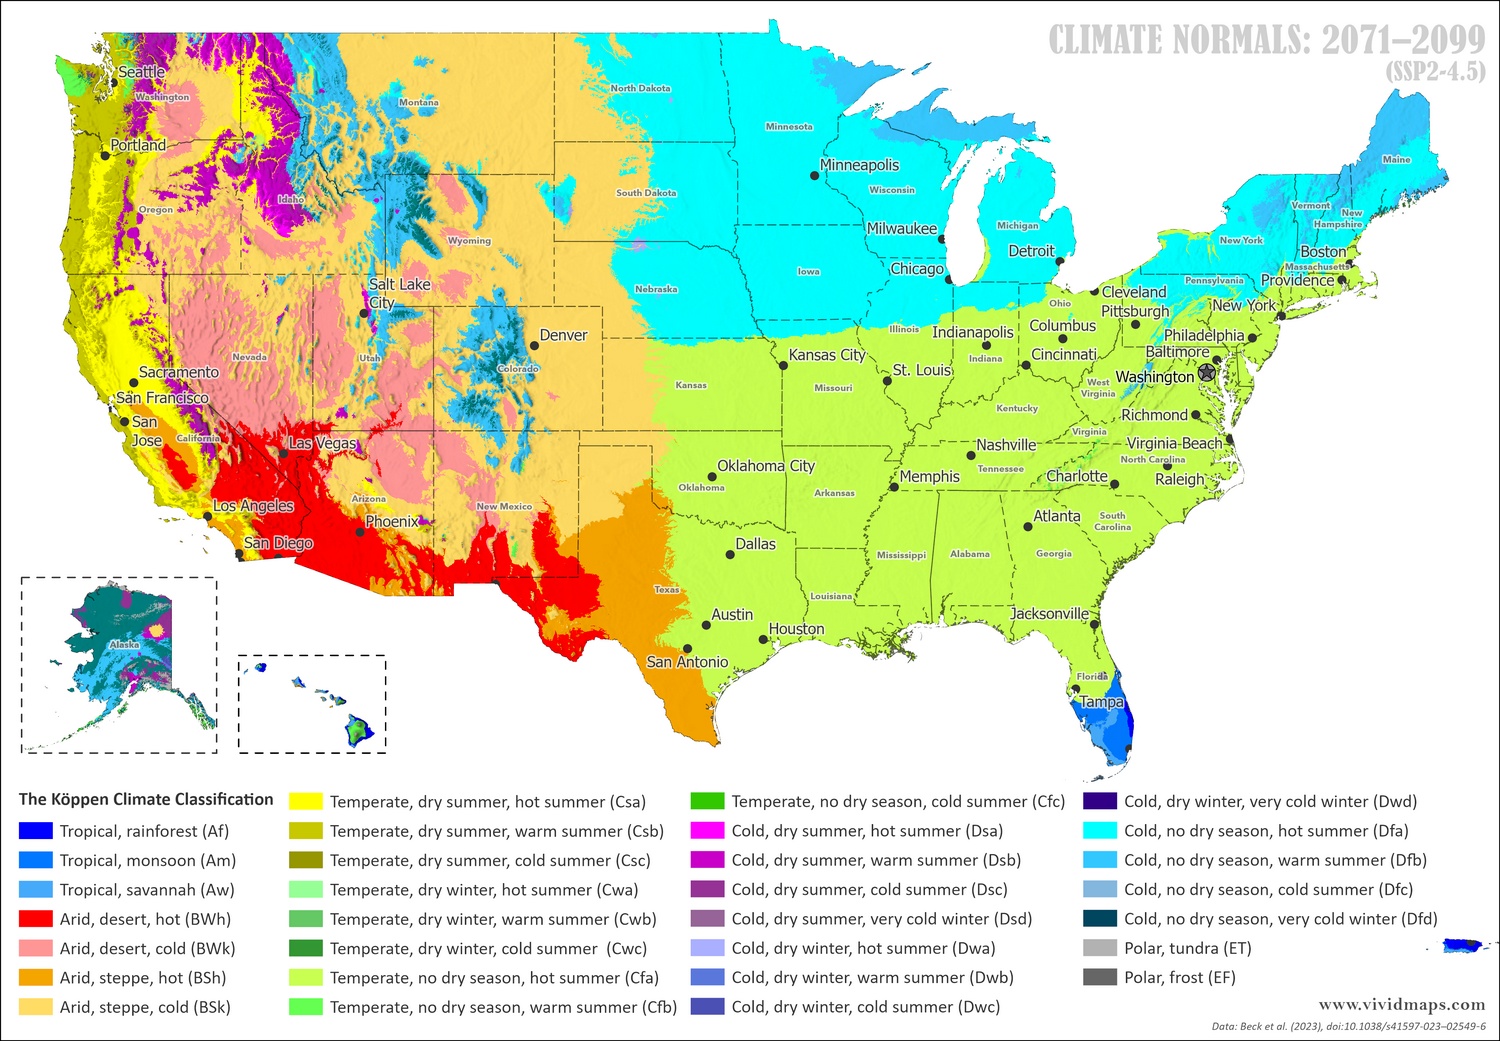
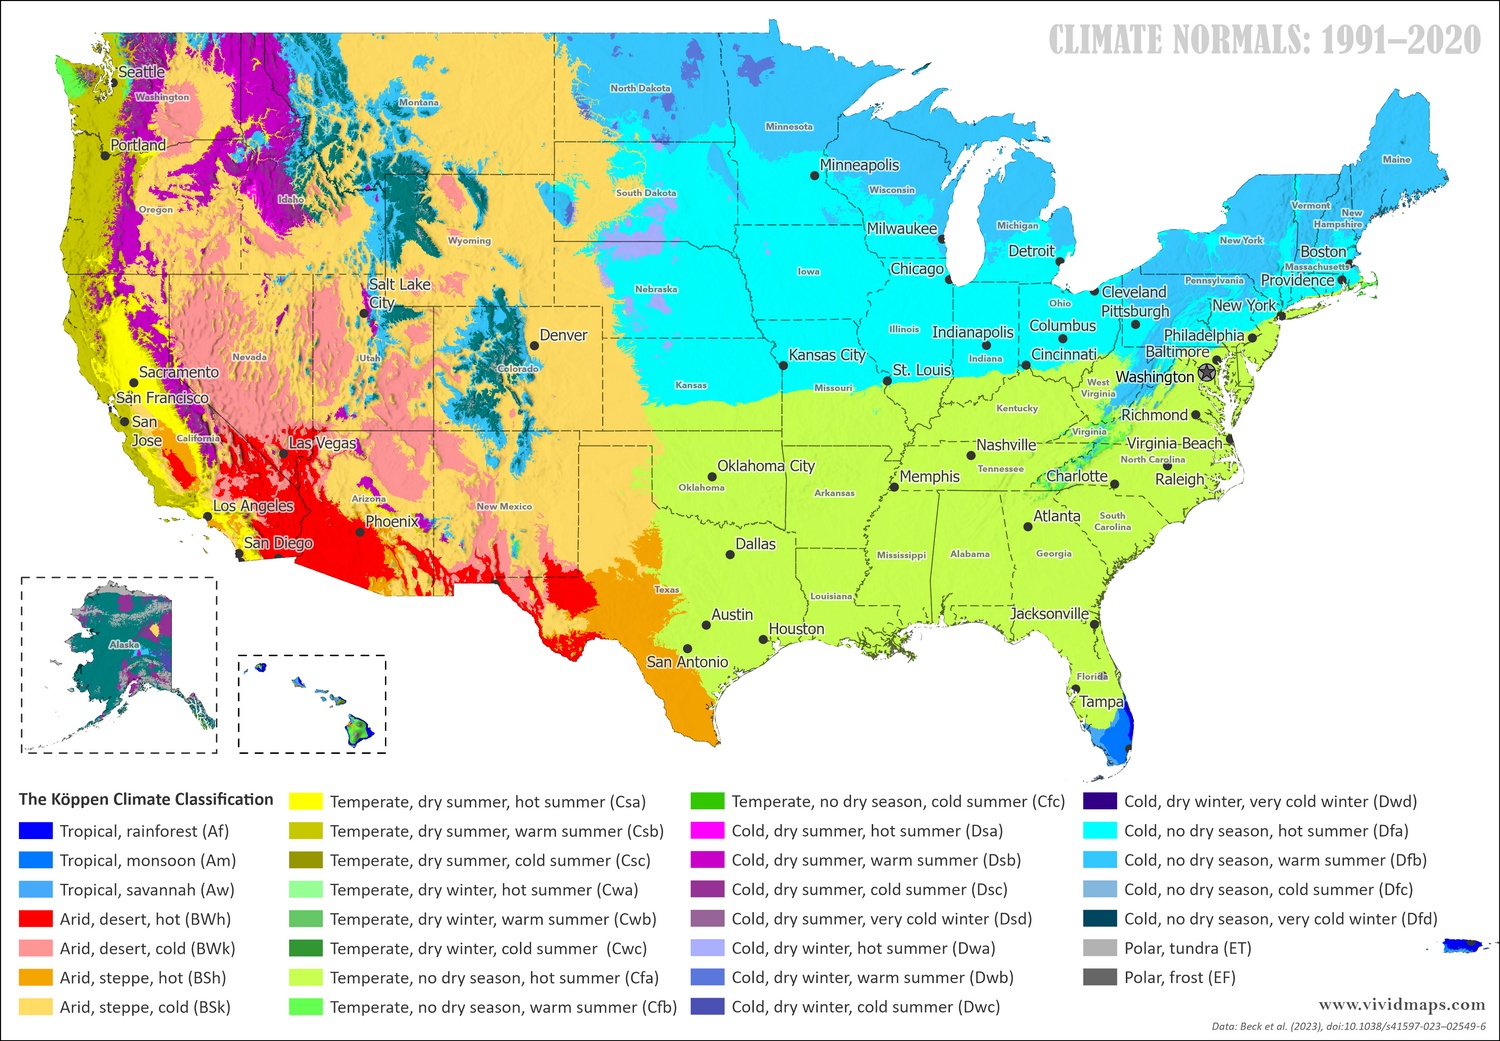
Climate zones today (1991–2020) compared with late-century projections (2077–2099, ssp2-4.5).
The trends visible in the 20th century accelerate. Alaska’s tundra zones retreat dramatically northward toward the Arctic coast. Subarctic zones shrink. In the Lower 48, cold continental climates (Dfa, Dfb, Dfc) pull back from the upper Midwest and northern Plains, replaced by temperate classifications. The humid subtropical zone (Cfa) pushes northward into areas that were once continental. Look at the Great Basin and the Southwest: the reds and pinks of true desert spread wider, and the yellows of steppe move into areas that once got more reliable moisture. Mountains still buffer some of the warming because elevation keeps temperatures cooler, but even in the Rockies and Cascades you can see zones creeping upslope. The Pacific coast changes less dramatically than inland areas because the ocean moderates temperature swings, but warming still shows up even there.
The Full Century and Beyond
When you step back and look at the full span from 1901–1930 to 2077–2099, the magnitude of change becomes clear.
Climate zones from 1901–1930 to 2077–2099.
Zones that dominated northern states in 1930 have vanished or retreated to Canada by century’s end. The geographic center of many climate types shifts hundreds of kilometers northward. Alaska transforms from a predominantly subarctic and polar region to one where subarctic zones dominate and tundra becomes confined to the northernmost coast. Georgia’s climate starts looking more like northern Florida used to. Kansas and Nebraska lose some of their coldest winter characteristics. The arid West grows larger.
These changes will mean completely different growing seasons for farmers, different water availability for cities, different fire regimes for forests, different species compositions in ecosystems. The places where certain crops thrive move. The northern limits of pests and diseases move. The places where certain trees can regenerate after disturbance move.
I also created maps for intermediate periods: 1931–1960 and 2041–2070. Using all these time periods together, I put together an animation that shows the progression through the mid-21st century transitions more smoothly.
If you’d like to see static versions of the 1931–1960 or 2041–2070 maps alongside the others, let me know in the comments and I can add those graphics to this post.


?")


