When we talk about the cost of living across different countries, transportation often reveals surprising economic disparities and purchasing power patterns. Let’s explore an intriguing question: How far can your daily wages take you, quite literally, around your city?
The Daily Commute: A Tale of Taxi Travel
Picture this: You step out of your home in Moscow, hail a taxi, and can travel 93 kilometers (58 miles) on your daily wages. Meanwhile, your colleague in London might only manage 20 kilometers (12.4 miles) on their daily salary. This stark contrast highlights how local economies shape our everyday mobility choices.
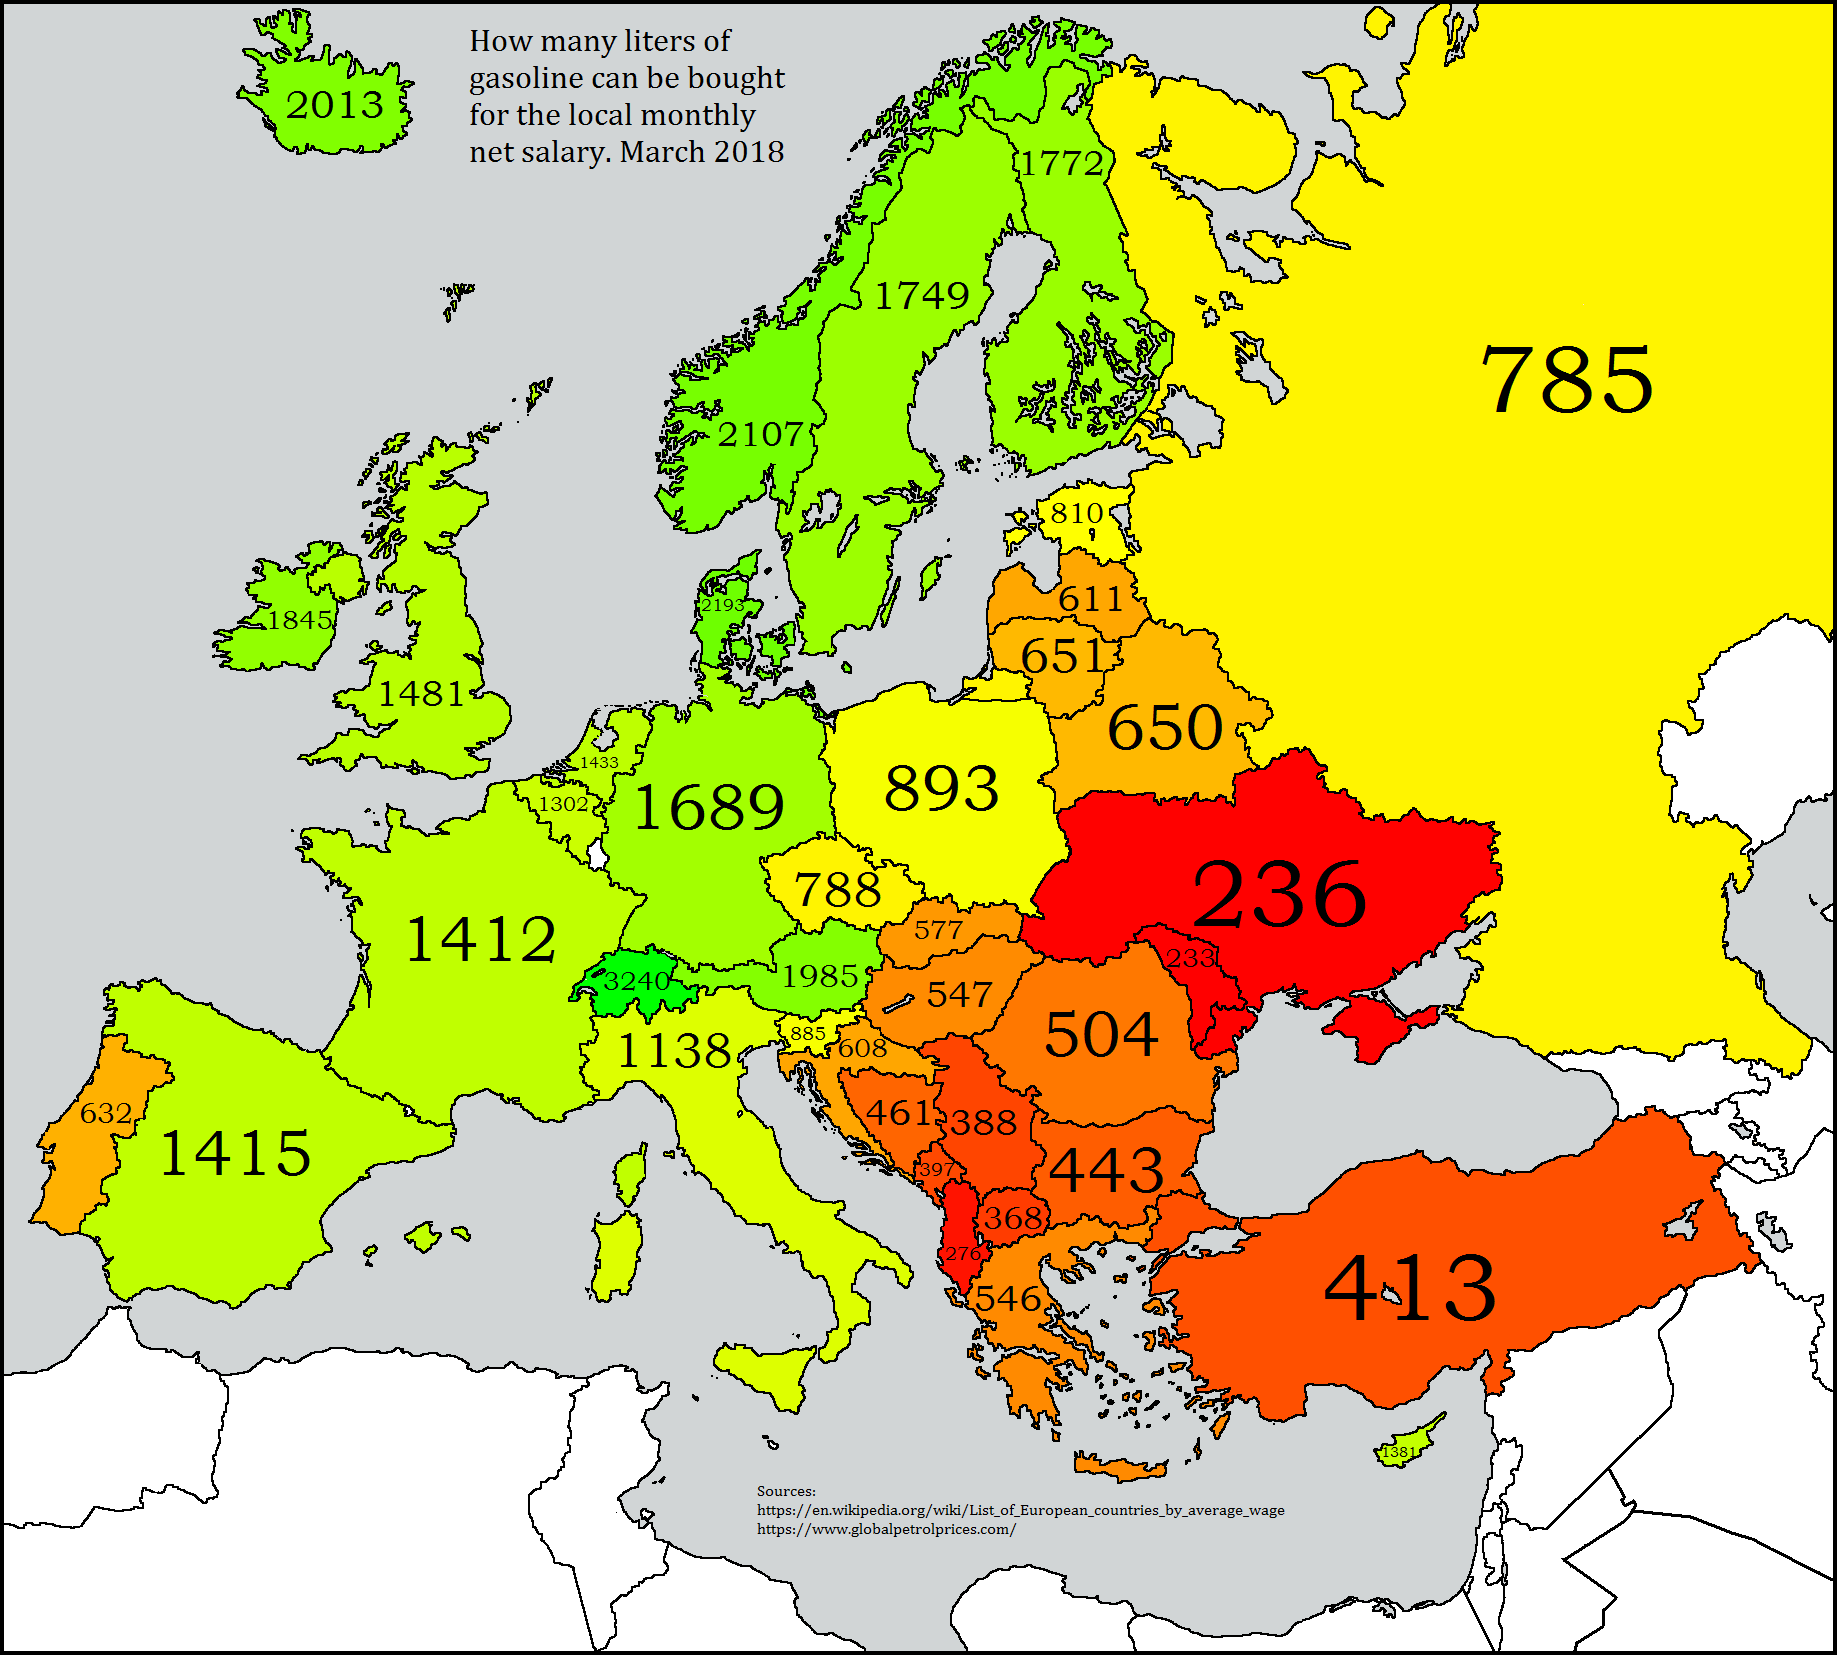
Map displaying liters of gasoline purchasable with monthly net salary (March 2018)Data source: numbeo.
The geographical patterns here are fascinating. Northern European countries like Norway (78 km/48.5 miles) and Sweden (66 km/41 miles) show strong purchasing power for taxi travel, while Eastern European nations present a more varied picture. Russia’s surprising lead at 93 kilometers (58 miles) suggests a complex interplay between wage levels and transportation costs.
What’s particularly interesting is how some countries with lower average salaries, like Portugal (65 km/40.4 miles) and Estonia (64 km/39.8 miles), offer relatively good taxi mobility. This points to the importance of looking beyond raw income figures to understand true purchasing power.
Fill ‘Er Up: The Fuel Perspective
Now, let’s shift gears and look at another metric: how many liters of gasoline a monthly salary can buy. This reveals an entirely different pattern of mobility freedom across Europe.
Map showing kilometers of taxi travel possible with one day’s average salary (2018). Data source: globalpetrolprices.com.
The data paints a clear picture of economic divides. Switzerland leads dramatically with 3,240 liters (856 gallons) per monthly salary – nearly 14 times more than Moldova’s 233 liters (62 gallons). This gap creates what we might call “mobility inequality,” where the freedom to travel becomes directly tied to geography and economic status.
The North-South gradient is particularly striking:
Nordic and Western European countries consistently show high fuel purchasing power, with Denmark at 2,193 liters (580 gallons) and Norway at 2,107 liters (557 gallons)
Southern and Eastern European nations generally cluster in the lower ranges, such as Serbia with 388 liters (102.5 gallons)
A clear economic divide emerges along former Cold War boundaries
The Shifting Landscape of Mobility Costs
The transportation landscape has transformed significantly since 2018. Recent global events have reshaped how we think about mobility:
Map showing the average cost of 1 liter (0.26 gallons) of gasoline (95 octane) in U.S. dollars, 2023. Source: The World Maps (@thewrldmaps)
These changes reflect broader economic patterns and challenge us to think about sustainable transportation solutions. In many cities, we’re seeing a shift toward electric vehicles and enhanced public transportation networks, particularly in regions where private transportation costs consume a significant portion of monthly wages.
What’s your experience with transportation costs in your region? Have you noticed significant changes in how far your salary takes you? Share your observations below – your local perspective adds valuable context to these global patterns.


 Expensive To Be an Apple Superfan?")

