The world is a diverse mosaic of cultures, languages, and landscapes. Yet, when you divide it by population, some surprising patterns emerge. Maps illustrating regions of the world with approximately equal populations offer a unique perspective on global demographics, sparking curiosity and fresh insights. Here, we explore such divisions across different maps, shedding light on how people are distributed across our planet.
Four Regions of Equal Population (2018)
The first map from 2018 divides the world into four regions, each containing approximately 1.9 billion people:
The Americas and West/Central Africa: Spanning North and South America and portions of Africa.
Europe and East Africa: This region includes Europe, East Africa, the Middle East, and Northern Asia.
South Asia: Focused on India, Pakistan, Bangladesh, and Sri Lanka.
East Asia and Oceania: Featuring Southeast Asia, China, and Ocean
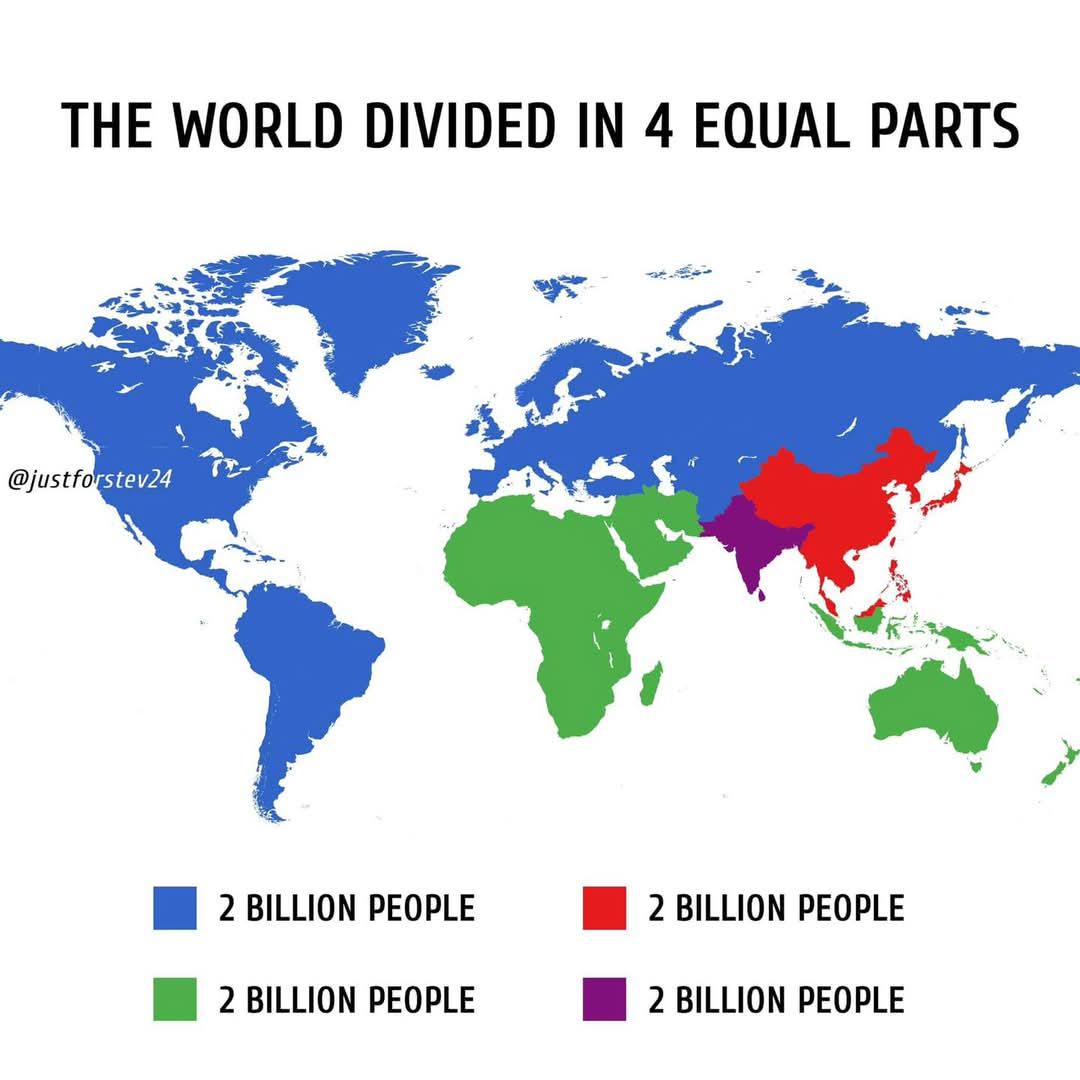
Four Regions of Equal Population (2024)
A new map created in 2024 by @justforstev24 reimagines the world divided into four equal parts, each with 2 billion people. The regions are:
The Americas and Europe: Includes North and South America, Europe, Turkey, Afghanistan, Mongolia, and countries of the former Soviet Union (except Azerbaijan).
Africa and Oceania: This region encompasses the Middle East, Iran, Azerbaijan, Africa, Madagascar, Australia, New Zealand, and Indonesia.
South Asia: Comprises India, Pakistan, Bangladesh, and Sri Lanka.
East Asia: Includes China, Japan, Korea, and other Southeast Asian nations.
This updated version offers a slightly different lens on global population distribution, with notable shifts reflecting demographic trends and geopolitical boundaries.
What These World Maps Tell Us About Population
Maps like these highlight the stark contrasts in population density worldwide. For example:
Asia dominates: Home to over half the world’s population, regions centered around India and China consistently dominate these divisions.
Africa’s growth: Africa’s inclusion in diverse groupings reflects its rapidly growing population, projected to double by 2050.
Sparse Americas: The Americas’ vast landmass contrasts with its relatively low population density compared to regions like South Asia.
Such visualizations underscore the importance of understanding population dynamics in addressing global challenges like urbanization, resource allocation, and climate change.
Fascinated by these maps? You can bring the world into your space with posters showcasing diverse themes of world maps, available on Amazon. They’re not just visually striking decor—they’re also fantastic educational tools.