In the realm of economic indicators, GDP per capita stands as a crucial metric, reflecting the average economic output per person in a given country. Analyzing its historical trajectory offers profound insights into a nation’s economic development over time. The maps below show the fascinating evolution of GDP per capita in Europe, comparing the year 1890 with the more recent year 2017.
1890: The Landscape of Europe
In 1890, Europe was a continent marked by significant economic diversity. Industrialization had taken firm root in Western Europe, particularly in countries like the United Kingdom, Germany, and France. These nations boasted relatively high GDP per capita figures, reflecting their advanced industrial economies.
Conversely, Eastern and Southern European countries lagged behind, characterized by agrarian economies and lower GDP per capita values. Countries such as Russia, Bulgaria, and Greece exemplified this trend, showcasing a stark disparity in economic development within Europe.
The map below, created by Reddit user Kamil1707, shows GDP per capita in Europe in 1890, adjusted to 2017 dollars.
GDP per capita in Europe in 1890 (in 2017 $)
According to the map, in 1890, the poorest country was Bosnia and Herzegovina, and the richest was Great Britain.
2017: A Transformed Continent
Fast forward to 2017, and Europe had undergone a dramatic transformation. The aftermath of two world wars had reshaped the continent’s economic landscape, leading to unprecedented levels of cooperation and integration.
Western European countries continued to lead in GDP per capita, with nations like Luxembourg, Switzerland, and Norway ranking among the highest globally. These countries had diversified their economies beyond heavy industry, expanding into finance, technology, and services.
In Eastern and Southern Europe, the picture had also evolved significantly. The fall of communism had ushered in a wave of economic reforms, leading to improved GDP per capita figures in countries like Poland, Hungary, and Romania. While still below Western European levels, these countries had made substantial strides towards closing the gap.
GDP per capita in Europe in 2017
Top 20 richest countries in Europe per capita, 2017 (GDP per capita, $).
1. Luxembourg (106,374)
2. Ireland (75,538)
3. Norway (71,831)
4. Switzerland (61,422)
5. San Marino (59,466)
6. Netherlands (53,635)
7. Iceland (51,842)
8. Sweden (51,475)
9. Germany (50,425)
10. Denmark (49,883)
11. Austria (49,869)
12. Belgium (46,553)
13. Finland (44,333)
14. United Kingdom (44,118)
15. France (43,761)
16. Malta (41,945)
17. Spain (38,286)
18. Italy (38,140)
19. Cyprus (37,023)
20. Czech Republic (35,512)
Top 20 pooriest countries in Europe per capita, 2017 (GDP per capita, $) 1. Moldova (5,661) 2. Ukraine (8,713) 3. Armenia (9,456) 4. Kosovo (10,515) 5. Georgia (10,747) 6. Albania (12,507) 7. Bosnia and Herzegovina (12,724) 8. FYR Macedonia (14,914) 9. Serbia (15,000) 10. Azerbaijan (17,492) 11. Montenegro (17,736) 12. Belarus (18,931) 13. Bulgaria (21,687) 14. Croatia (24,424) 15. Romania (24,508) 16. Latvia (27,644) 17. Greece (27,737) 18. Russia (27,834) 19. Hungary (29,474) 20. Poland (29,521)
If European history piques your interest, we recommend exploring these books.


GDP per capita in Europe back to 1890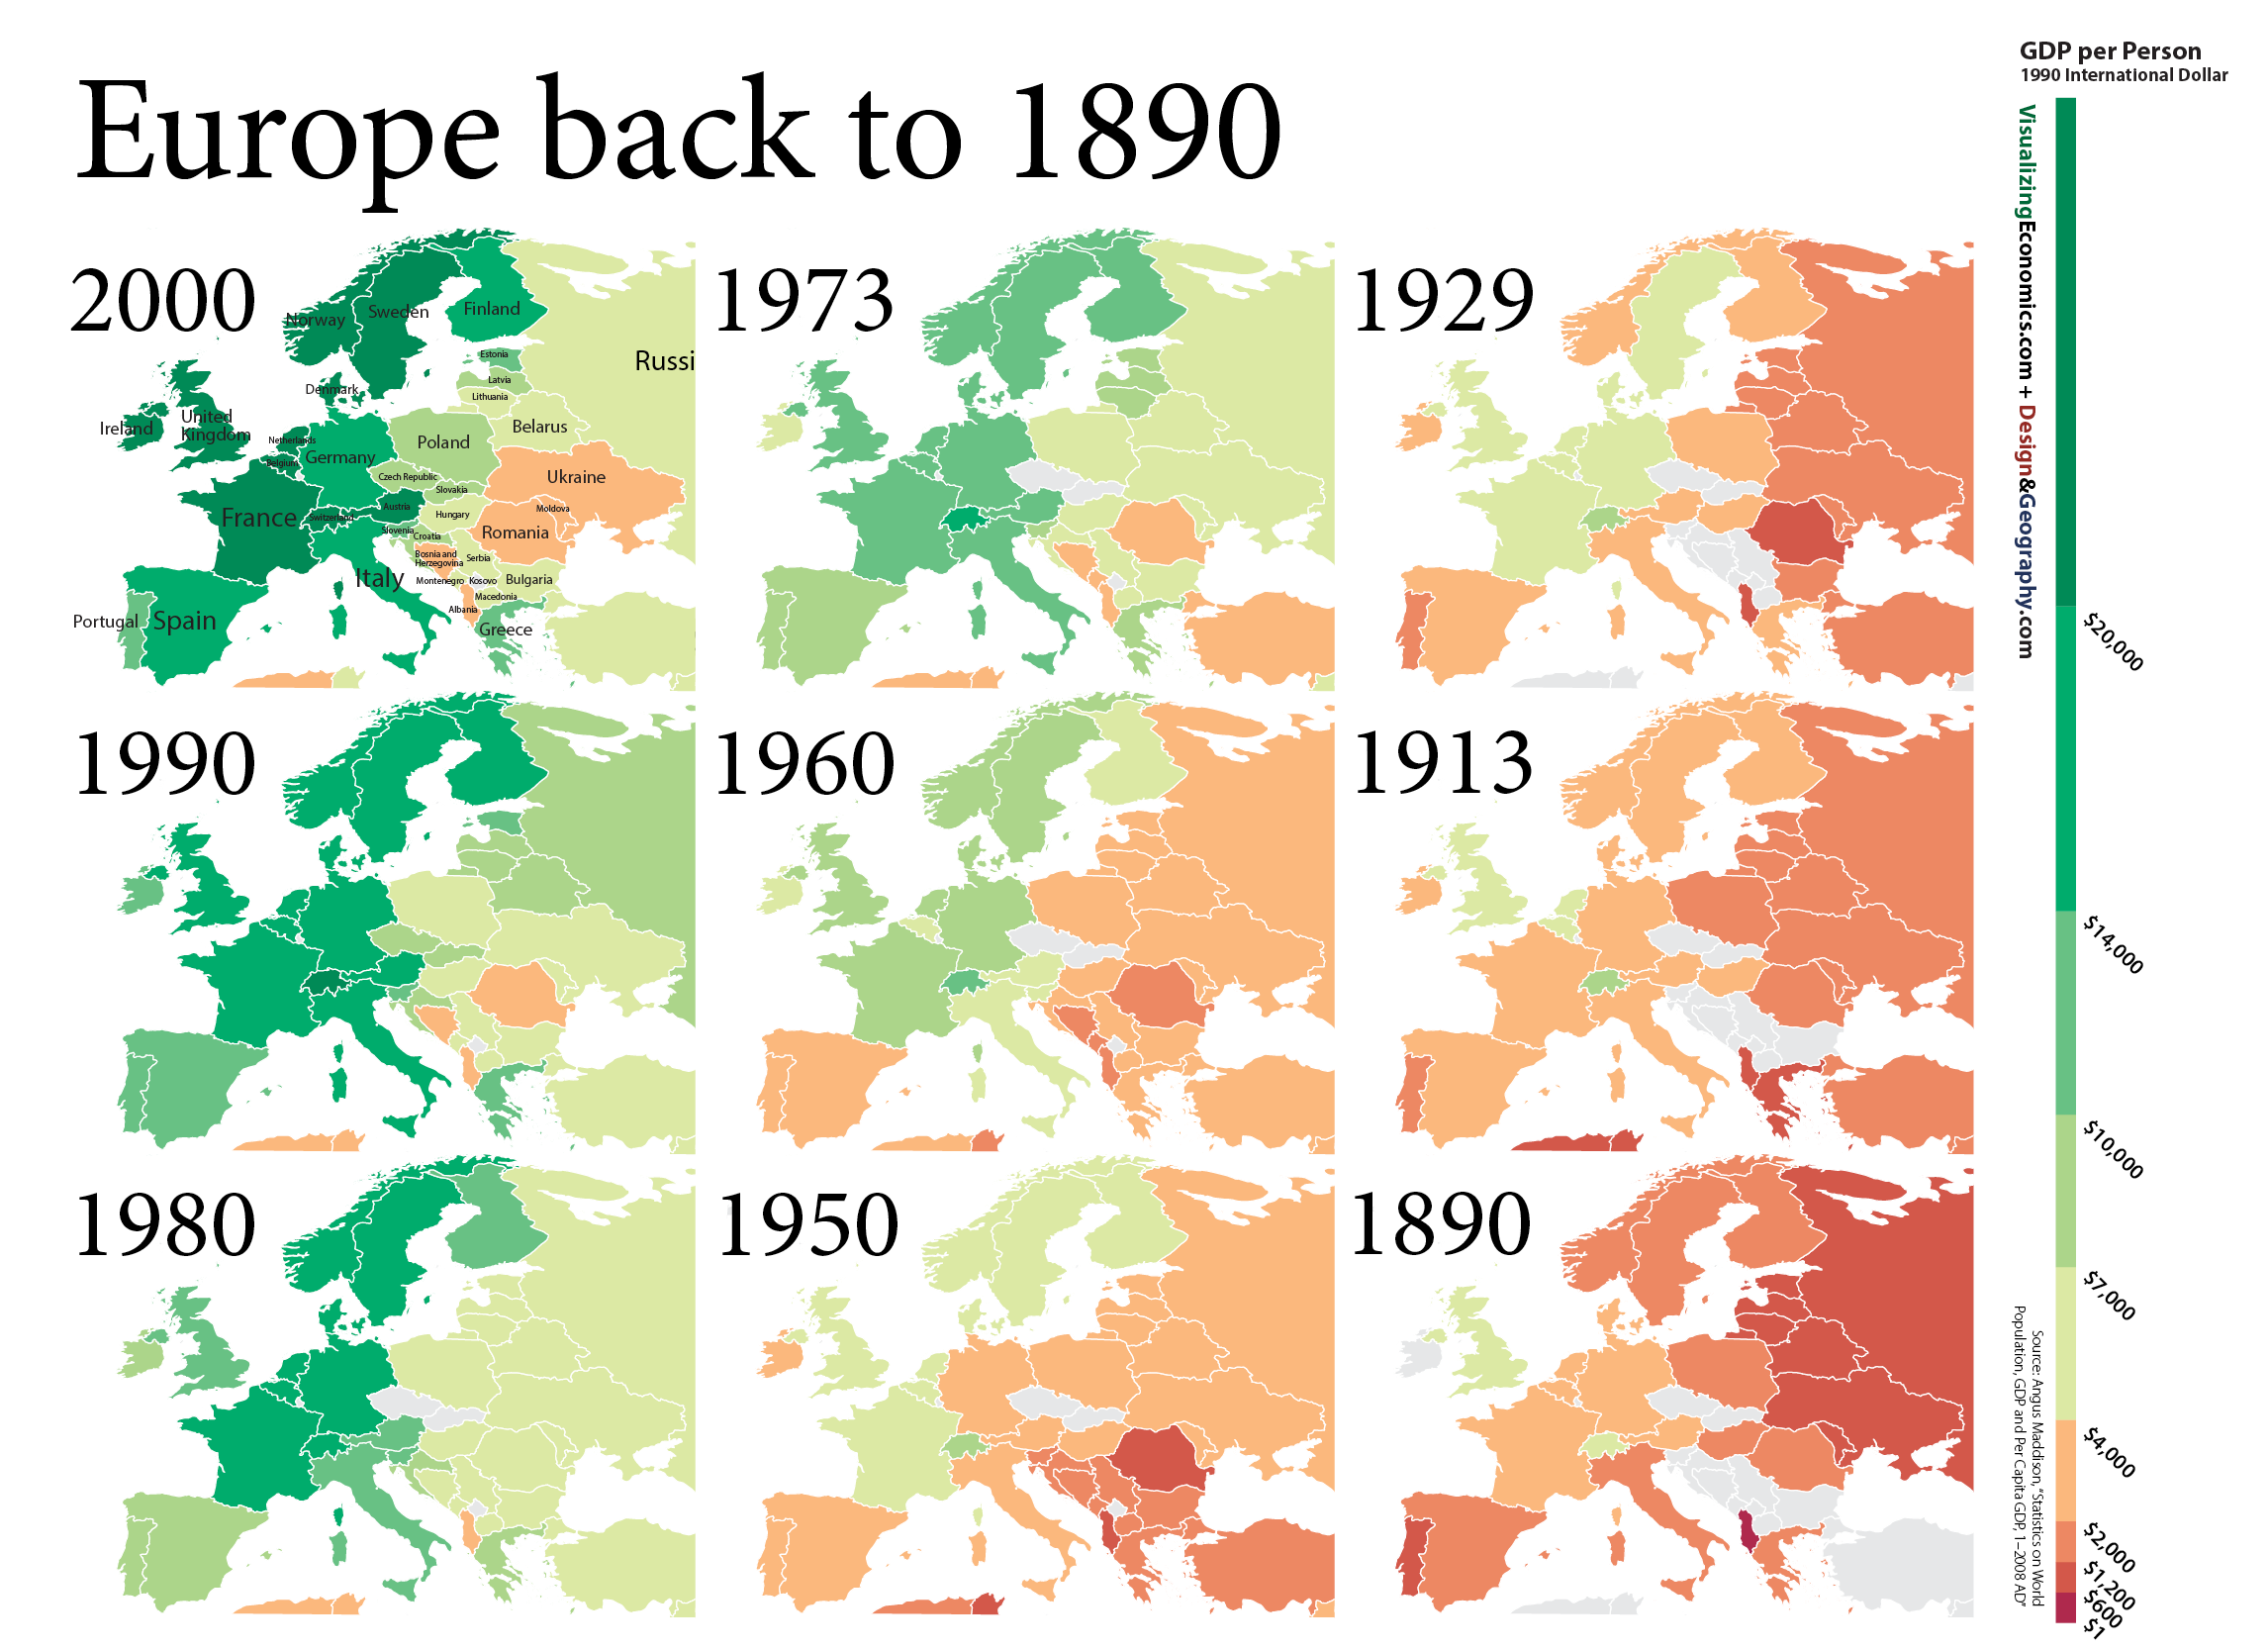
modern borders used for times when these borders didn’t exist
doesn’t look realistic !!
Compare to 59,531.66 USD (2017) for US.
$32,102 in 2016 for Mississippi
This is just per capita. Try with purchasing power parity.