Every summer it seems we wake up to another headline about record-breaking heat in Europe. The most recent reports about the heatwave in France are just the latest reminder that these stories are becoming part of the seasonal news cycle.
To understand the scale of change, take a look at the side-by-side maps created by Josh Holder for The New York Times, using Copernicus ERA5 climate data that shows the number of days per year when temperatures exceeded 30ºC (85°F) in Europe.
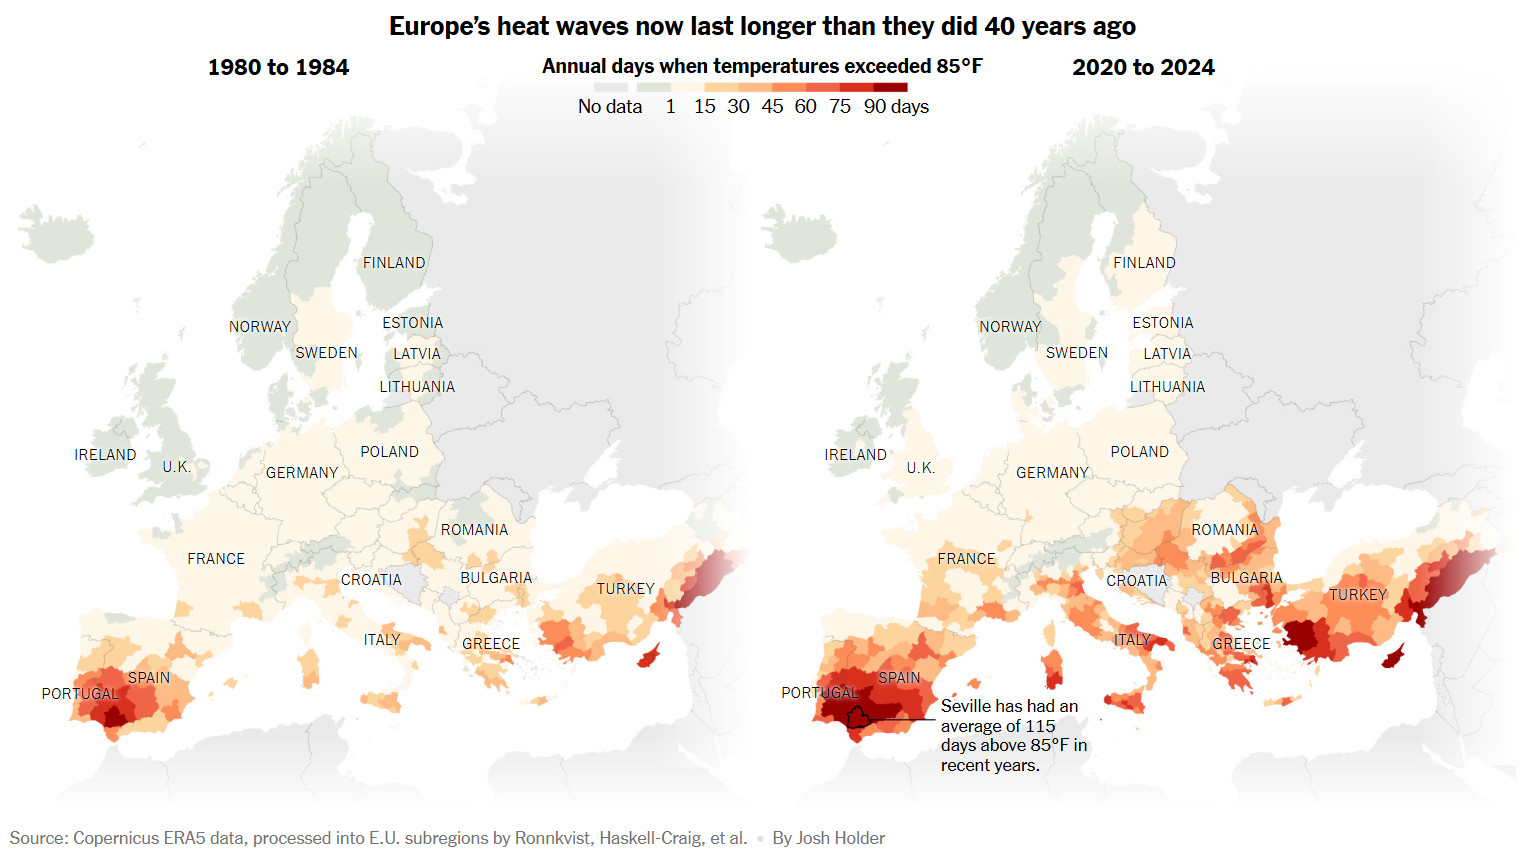
To understand the scale of change, take a look at the side-by-side maps created by Josh Holder for The New York Times, using Copernicus ERA5 climate data that show the number of days per year when temperatures exceeded 30ºC (85°F) in Europe for the period 2020-2024 compared to the period 1980-1984.
The maps show a clear transformation. In the early 1980s, most of northern and western Europe barely registered more than a handful of days above 30ºC each year. Fast forward to 2020–2024, and parts of Spain and southern France are now experiencing two to three months of these hot days annually. Even regions further north (Austria, Germany, Poland, the UK, Czechia, Slovakia, Hungary, Romania ) have seen sharp increases.
This isn’t just about more days of discomfort. Longer, hotter summers affect agriculture, water supply, energy demand, and even the way cities are built.
If you want to look beyond the present into the future, I recommend exploring my own interactive map: Find Cities With a Similar Climate (2050). I built it using the Global Environmental Stratification dataset, which models climate shifts under four different emissions scenarios. With it, you can compare how today’s European capitals will resemble cities much further south by mid-century.
Maps like these make climate change tangible. Instead of abstract numbers, they show us where summers are lengthening and intensifying. And if current trends continue, the transformation we’ve already seen between the 1980s and 2020s may look modest compared to what’s ahead.
?")


