That’s a loss of more than three people per home. But these numbers hide big differences depending on where you live.
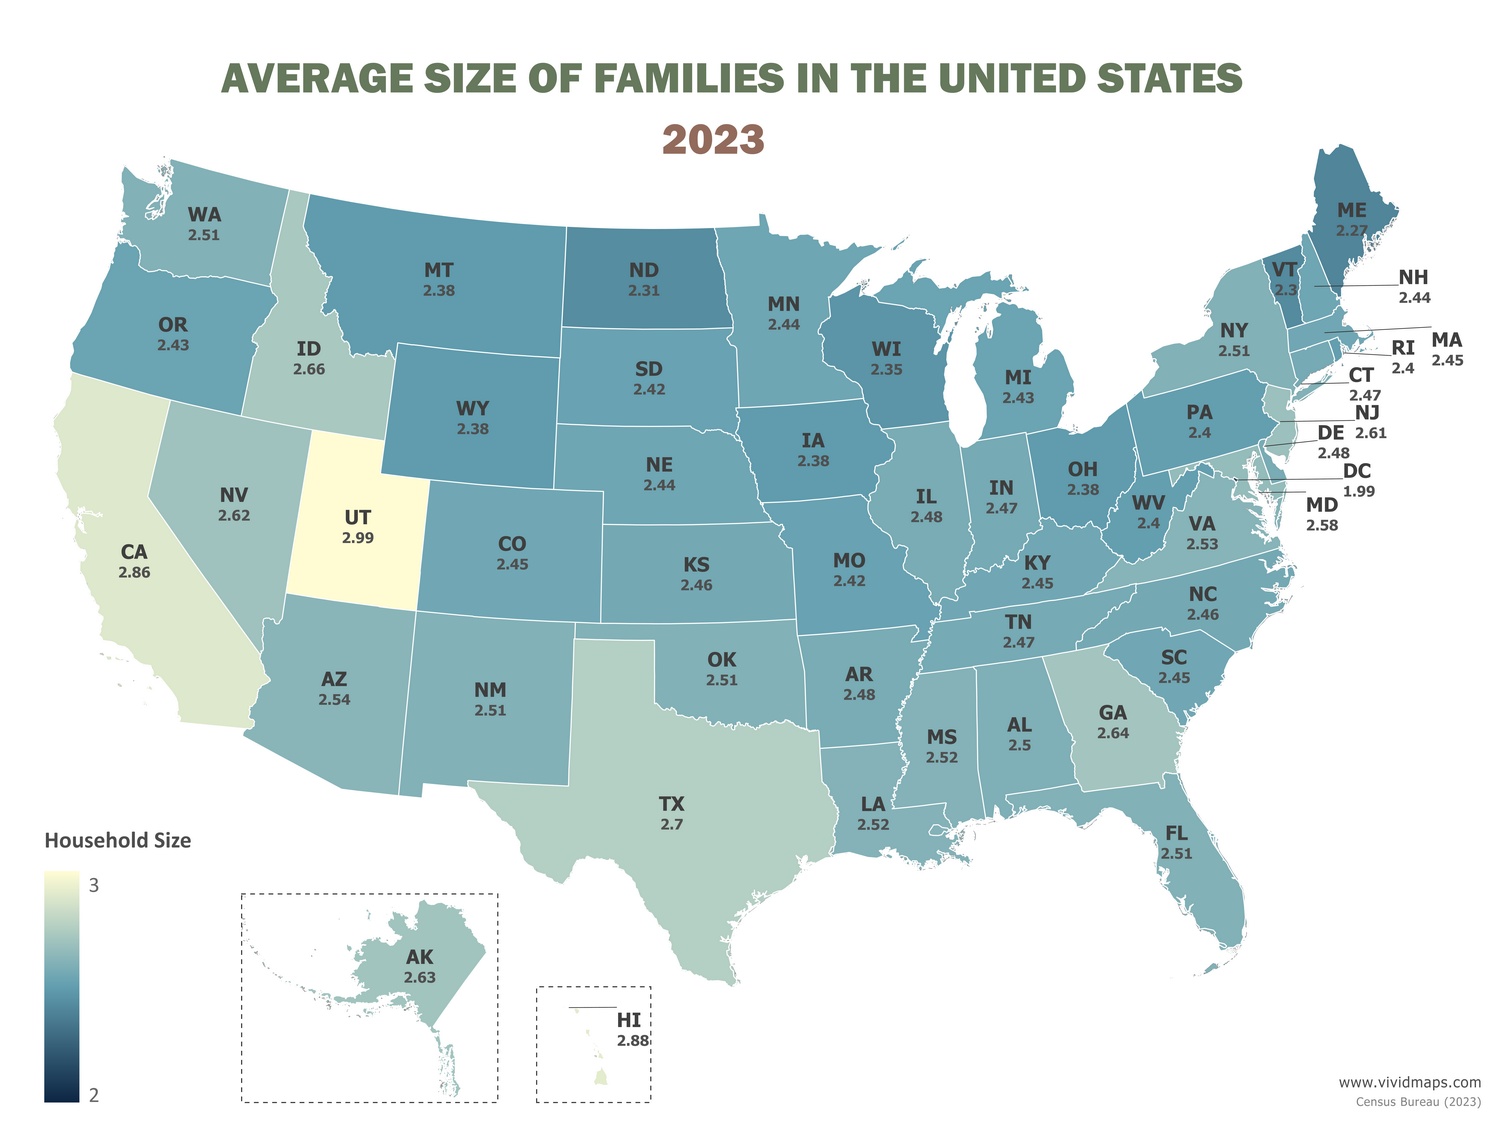
Utah leads with 2.99 people per household. Washington D.C. sits at 1.99. The West leans toward bigger households. The Northeast? Smaller.
Why does Utah have more people per home? Birth rates. In 2013, 13.0 babies were born per thousand Utahns. The national rate was 10.7. Utah’s fertility rate has been falling for fifteen years straight, down to 1.801 in 2023. But families there still have more kids than families almost anywhere else.
Hawaii’s next at 2.88. California’s at 2.86. Part of this comes down to who lives there. If you look at Hispanic households specifically, the average is 3.25 people. That’s above the overall U.S. number. Texas comes in at 2.70. Both California and Texas have large Hispanic populations. Three generations under one roof—grandparents, parents, kids—that’s common in many Hispanic families.
State
Average Household Size
Utah
2.99
Hawaii
2.88
California
2.86
Texas
2.7
Idaho
2.66
Georgia
2.64
Alaska
2.63
Nevada
2.62
New Jersey
2.61
Maryland
2.58
Arizona
2.54
Virginia
2.53
Louisiana
2.52
Mississippi
2.52
Florida
2.51
New Mexico
2.51
New York
2.51
Oklahoma
2.51
Washington
2.51
Alabama
2.5
Arkansas
2.48
Delaware
2.48
Illinois
2.48
Connecticut
2.47
Indiana
2.47
Tennessee
2.47
Kansas
2.46
North Carolina
2.46
Colorado
2.45
Kentucky
2.45
Massachusetts
2.45
South Carolina
2.45
Minnesota
2.44
Nebraska
2.44
New Hampshire
2.44
Michigan
2.43
Oregon
2.43
Missouri
2.42
South Dakota
2.42
Pennsylvania
2.4
Rhode Island
2.4
West Virginia
2.4
Iowa
2.38
Montana
2.38
Ohio
2.38
Wyoming
2.38
Wisconsin
2.35
North Dakota
2.31
Vermont
2.3
Maine
2.27
District of Columbia
1.99
United States
2.55
Vermont and Maine land at the bottom with 2.30 and 2.27 people per household. Both states have birth rates well below the national average. Their young people move away for work.
Washington D.C. at 1.99? That tracks. The city runs on young professionals—people working on the Hill, at law firms, consulting shops, tech startups. A lot of them live alone or with a roommate or partner. Kids aren’t in the picture, especially not with D.C. rents.
 rated fast-food chains across the United States")


