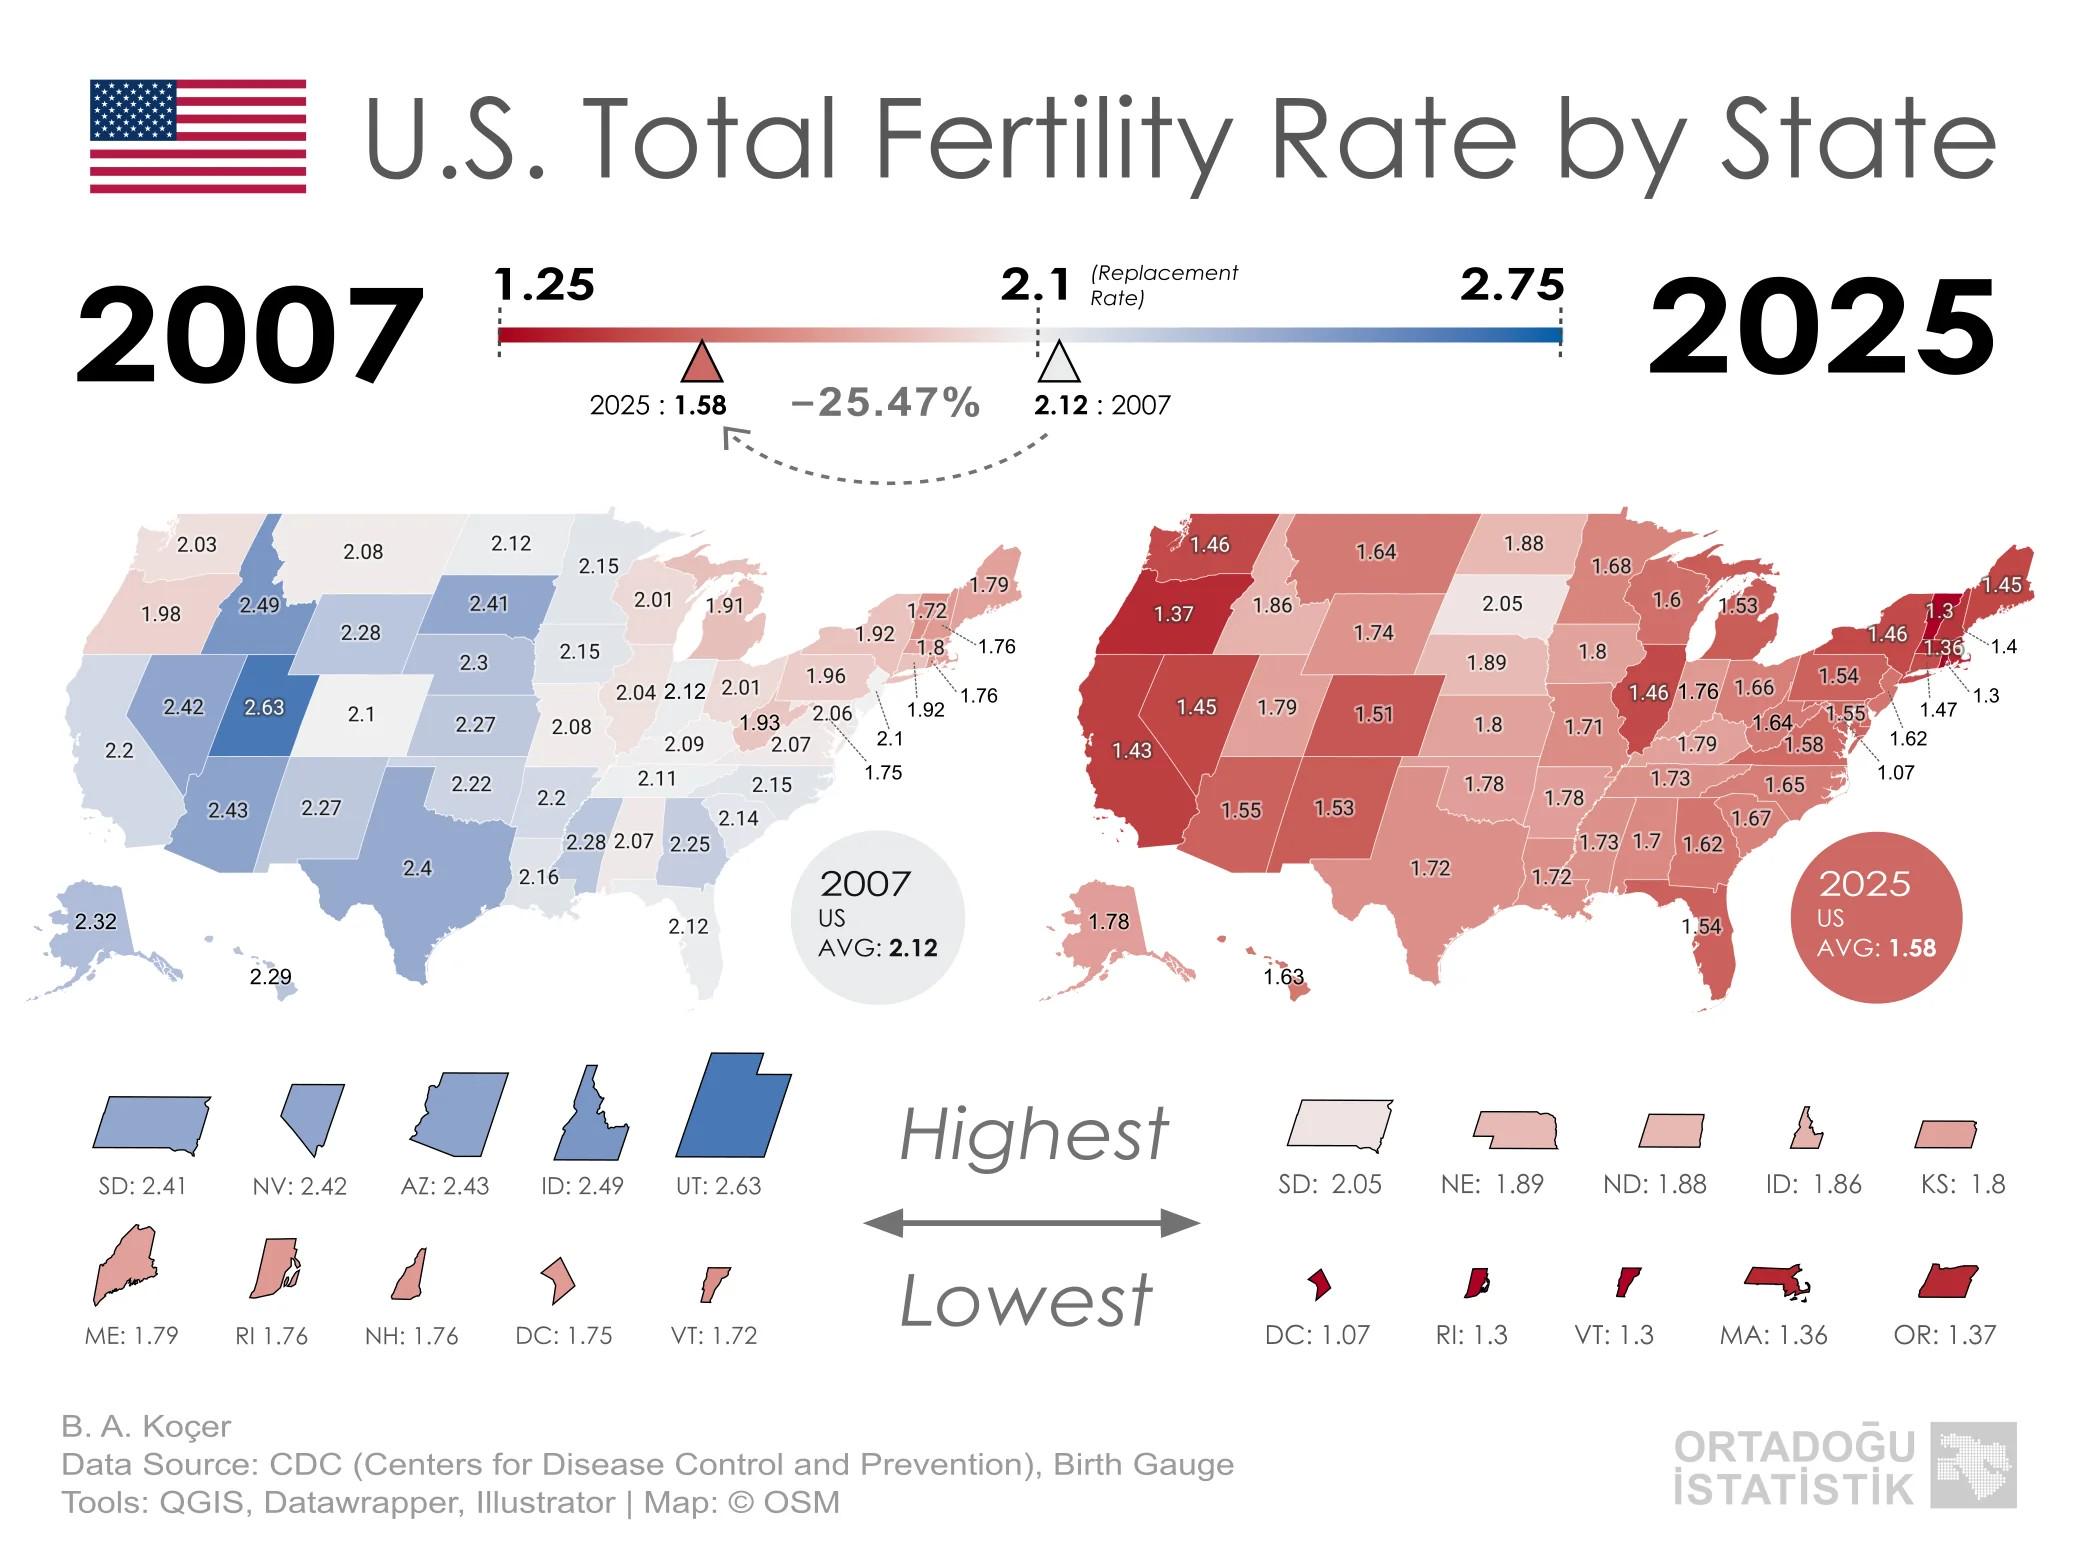
For much of the 1980s and 1990s, the U.S. total fertility rate hovered around 2.0, slightly below the 2.1 replacement level that keeps a population stable without immigration. Through the 2000s it climbed back. By 2007, it had reached 2.12, its highest since 1971 and above replacement for the second consecutive year. That turned out to be the ceiling.
The 2008 financial crisis ended the climb. Births fell 4% in just two years, the steepest short-term drop since the Great Depression. The rate steadied somewhat after 2013, then kept sliding through the late 2010s. A mild rebound followed the 2020 pandemic dip. It faded quickly. CDC provisional data for 2024, released in July 2025, puts the national TFR at 1.60. Birth Gauge’s 2025 estimates bring it to 1.58, a 25.5% decline from 2007.
Housing costs have risen faster than wages in most metro areas. Childcare now runs more than $10,000 a year in many states. Women are spending more years in education before family formation becomes a priority. Marriage rates have dropped steadily, and with them the demographic conditions that historically concentrated births in the most fertile years. None of these forces are new. They’d been building since the 1970s, and the recession supercharged all of them at once.
Utah’s 2007 rate of 2.63 was the highest in the country by a considerable margin, largely reflecting the LDS church’s cultural emphasis on early marriage and larger families. Idaho (2.49), Arizona (2.43), Nevada (2.42), and South Dakota (2.41) filled out the top five that year. By 2025, Utah was down to 1.79, a 31.9% decline from its 2007 peak. Still above the national average.
South Dakota at 2.05 is the only state still above replacement in 2025. Nebraska (1.89), North Dakota (1.88), Idaho (1.86), and Kansas (1.80) are next. All five share lower housing costs, agricultural and rural economies, and communities where earlier family formation remains more common. South Dakota also benefits demographically from a sizable Native American population with historically higher birth rates.
Vermont (1.30) and Rhode Island (1.30) share the lowest state-level figures in 2025, with Massachusetts (1.36) and Oregon (1.37) close behind. These are places where residents experience expensive housing, high female educational attainment, later marriage ages, and lower religious participation.
Washington D.C. falls into a different category. At 1.07 in 2025, it registers below the national fertility rate of every country in Western Europe. The district’s combination of sky-high housing costs and a professional demographic that skews heavily toward delayed or foregone parenthood has pushed it into territory more comparable to East Asia’s most urbanized cities.
State
2007 TFR
2025 TFR
Change
Alabama
2.25
1.70
−24.4%
Alaska
2.32
1.78
−23.3%
Arizona
2.43
1.55
−36.2%
Arkansas
2.16
1.78
−17.6%
California
2.20
1.43
−35.0%
Colorado
2.10
1.51
−28.1%
Connecticut
1.80
1.40
−22.2%
Delaware
2.01
1.55
−22.9%
District of Columbia
1.75
1.07
−38.9%
Florida
2.12
1.54
−27.4%
Georgia
2.14
1.62
−24.3%
Hawaii
2.29
1.63
−28.8%
Idaho
2.49
1.86
−25.3%
Illinois
2.04
1.46
−28.4%
Indiana
2.09
1.76
−15.8%
Iowa
2.20
1.80
−18.2%
Kansas
2.22
1.80
−18.9%
Kentucky
2.09
1.79
−14.4%
Louisiana
2.28
1.72
−24.6%
Maine
1.79
1.45
−19.0%
Maryland
2.01
1.62
−19.4%
Massachusetts
1.80
1.36
−24.4%
Michigan
1.91
1.53
−19.9%
Minnesota
2.15
1.68
−21.9%
Mississippi
2.07
1.73
−16.4%
Missouri
2.11
1.71
−19.0%
Montana
2.08
1.64
−21.2%
Nebraska
2.30
1.89
−17.8%
Nevada
2.42
1.45
−40.1%
New Hampshire
1.76
1.40
−20.5%
New Jersey
2.10
1.47
−30.0%
New Mexico
2.27
1.53
−32.6%
New York
1.92
1.46
−24.0%
North Carolina
2.06
1.65
−19.9%
North Dakota
2.12
1.88
−11.3%
Ohio
2.01
1.66
−17.4%
Oklahoma
2.22
1.78
−19.8%
Oregon
1.98
1.37
−30.8%
Pennsylvania
1.96
1.54
−21.4%
Rhode Island
1.76
1.30
−26.1%
South Carolina
2.25
1.67
−25.8%
South Dakota
2.41
2.05
−14.9%
Tennessee
2.15
1.73
−19.5%
Texas
2.40
1.72
−28.3%
Utah
2.63
1.79
−31.9%
Vermont
1.72
1.30
−24.4%
Virginia
2.07
1.58
−23.7%
Washington
2.03
1.46
−28.1%
West Virginia
1.93
1.64
−15.0%
Wisconsin
2.01
1.60
−20.4%
Wyoming
2.28
1.74
−23.7%
United States
2.12
1.58
−25.5%
California fell from 2.20 in 2007 to 1.43 in 2025, a 35.0% decline. Oregon dropped from 1.98 to 1.37, and Washington from 2.03 to 1.46. Nevada’s decline is sharper still, from 2.42 to 1.45, a 40.1% drop over 18 years. In all four states, housing costs have climbed faster than in almost anywhere else in the country.
The CDC’s provisional 2024 figures show no sign of stabilization in any state. At the current pace, the national total fertility rate could approach 1.5 within a decade, placing the U.S. alongside Spain and Italy in the long-running management of below-replacement demographics. Whether large-scale immigration can fully compensate for that shortfall over time is a question demographers and economists haven’t settled.