Bicycle Stress Map
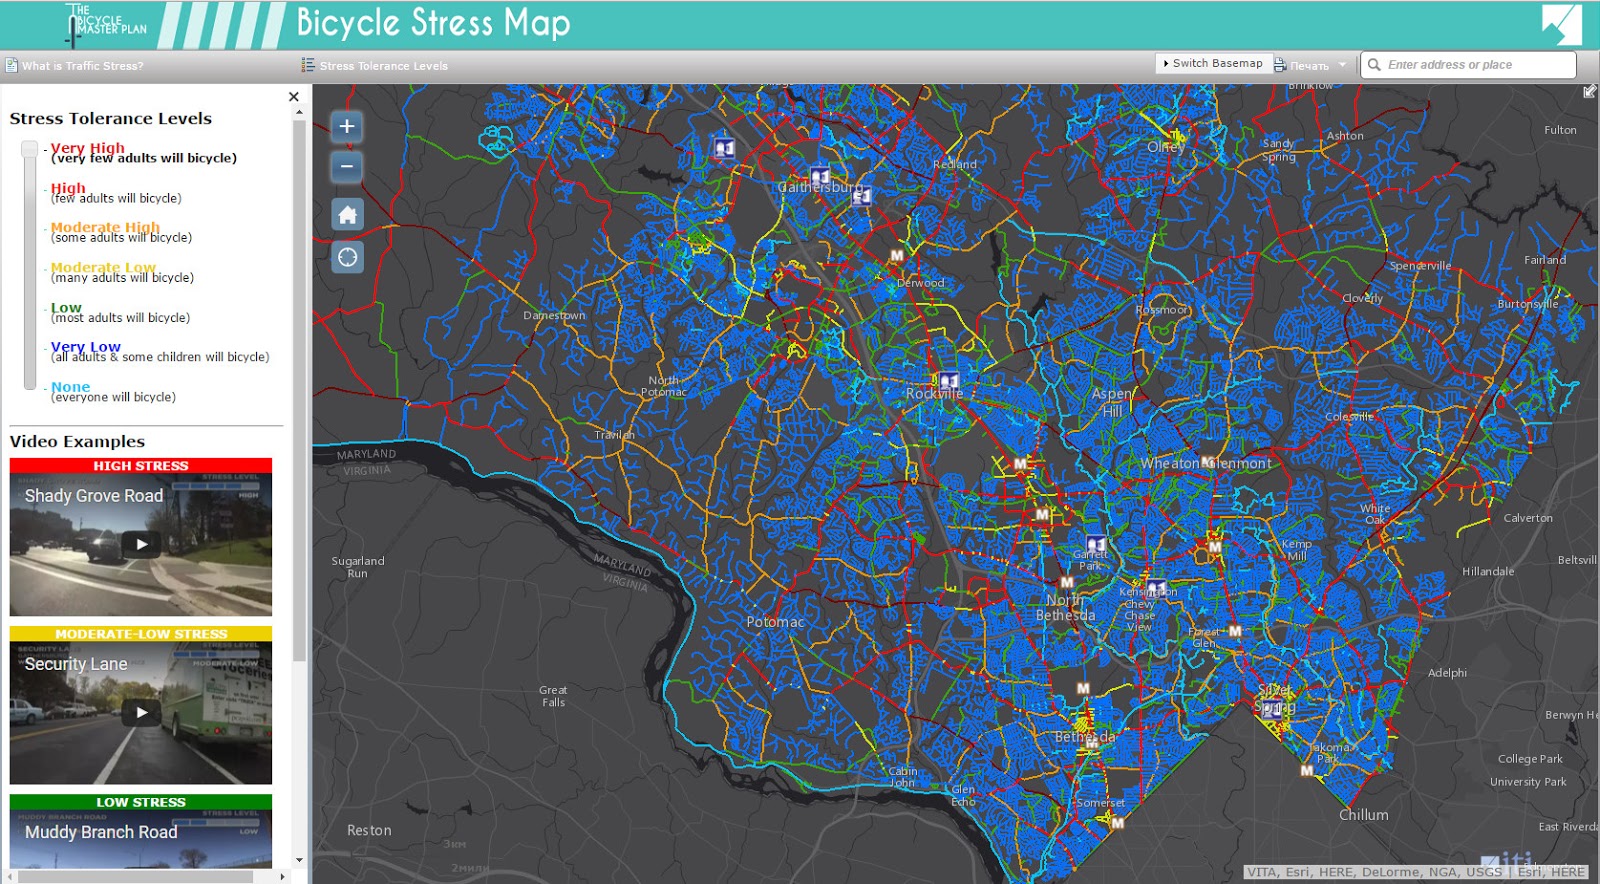
This map shows the levels of traffic stress that people who bicycle experience on each public road (excluding freeways) and trail in Montgomery County, Maryland. This tool is intended to assist planners in evaluating connectivity for bicyclists that tolerate different levels of traffic stress and to identify locations where investments are needed to reduce the level of traffic stress.
This application enables you to:
1. Understand Level of Traffic Stress
2. View videos showing different stress levels
3. Use the sliding scale to show those roads and trails that are appropriate for different stress tolerance levels
4. Click on metro stations to view connectivity analyses.
What is Traffic Stress?
When cyclists travel on roadways, they encounter varying levels of stress from traffic. A quiet residential street with a 25-mile-per-hour speed limit is considered a very low-stress environment for cyclists. But a six-lane suburban highway with a 40-mile-per-hour speed limit represents a high-stress environment for cyclists who must share the roadway with traffic. As a result, fewer people are likely to cycle on the highway.
Level of Traffic Stress (LTS) is an approach that quantifies the amount of stress that bicyclists feel when they ride close to traffic [1]. The Bicycle Masterplan team is proposing a modified version of the approach to evaluate traffic stress in Montgomery County [2].
The LTS methodology assigns a numeric stress level to streets (and other places where people can bicycle, like trails), based on attributes like traffic speed, traffic volume, number of lanes, frequency of parking turnover, ease of intersection crossings and other-characteristics.
When a street has a moderate or high level of stress, it may be a sign that bicycle infrastructure, like separated bike lanes or shared use paths, is needed to make it a place where more people will feel comfortable riding.


