The car took over as America’s main commute method back in the 1920s. People were driving five times more miles than they took trains even then. Fast forward a hundred years and nothing’s really changed.
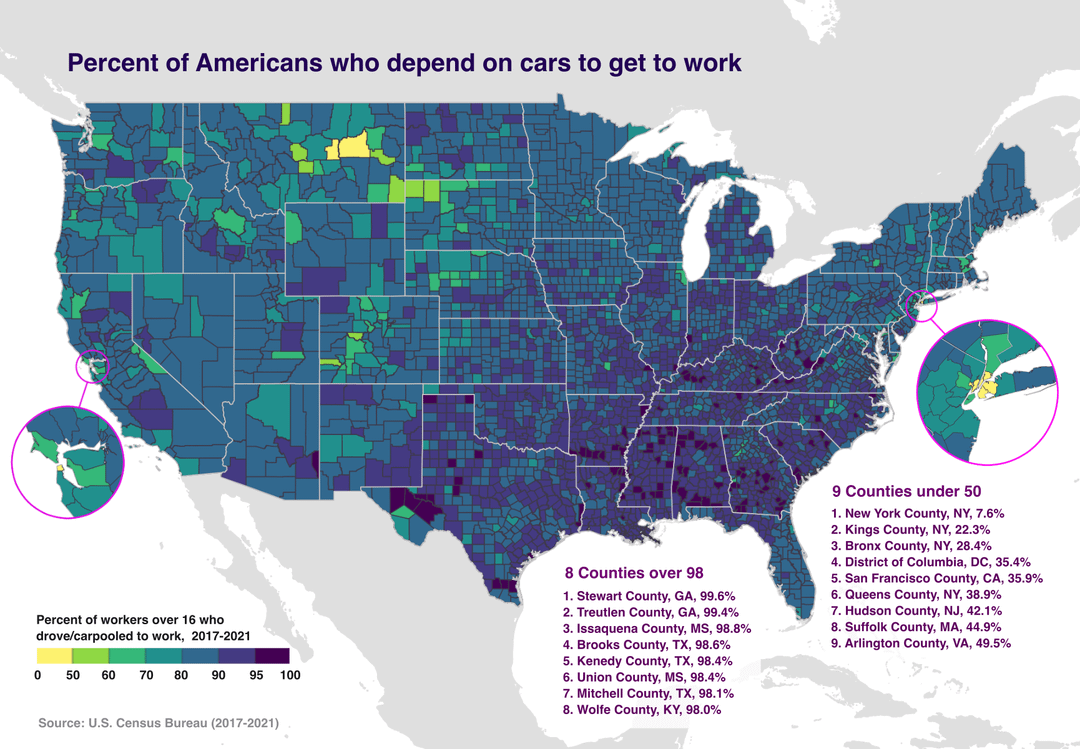
Using Census Bureau numbers from 2017-2021, Reddit user u/freeeshie created a map showing the percentage of workers who drive or carpool in each county. The range is huge. Some counties hit 99.6%, others barely reach 8%.
Where Almost Everyone Drives
Stewart County, Georgia leads the pack at 99.6%. Just below that is Treutlen County, also in Georgia, hitting 99.4%. Issaquena County in Mississippi is third at 98.8%.
Texas has three counties over 98%: Brooks (98.6%), Kenedy (98.4%), and Mitchell (98.1%). Union County in Mississippi hits 98.4%. Wolfe County, Kentucky wraps it up at 98.0%.
Every one of these is rural with sparse population spread across large areas. Stewart County? Just 5,000 people living across 463 square miles (1,200 km²). Down in the Mississippi Delta, Issaquena County has 1,200 residents.
Need groceries? The nearest store might be 15 or 20 miles (24-32 km) away. No buses run. You can’t walk those distances. Either you’ve got a working car or you’re not getting to work.
Where Cars Are Optional
Manhattan flips the script completely. Only 7.6% of workers there drive to their jobs. Brooklyn’s at 22.3%. The Bronx is at 28.4%.
D.C. sits at 35.4%. San Francisco is 35.9%, Queens is 38.9%. Hudson County in New Jersey is 42.1%, Boston is 44.9%, Arlington County in Virginia is 49.5%.
What do these nine counties share? Subways and buses everywhere. Manhattan’s subway system opened in 1904. San Francisco had streetcars in the 1870s. These places built dense, walkable layouts before cars dominated, and kept their transit running while other cities dismantled theirs.
The Pandemic Changed Nothing
COVID sent people home to work for a while, and fewer people drove. But that shift was temporary. Remote work fell from 13.8% to 13.3% between 2023 and 2024, per Census data. The percentage who drove alone? 69.2% both years.
Cars grabbed 0.4 percentage points more of all commuting in 2024. Transit ridership came back up a bit from the pandemic crash but still hasn’t hit 2019 numbers.
45% of Americanscan’t access public transit at all. Americans spend an average of $12,295 per year on transportation, which puts it right up there with housing as a major expense. If you live in one of those high-dependency counties, there’s no way to cut that cost down. You need the car, period.
 rated fast-food chains across the United States")


