The lowest temperature recorded in each state/province of the US and Canada in Celsius & Fahrenheit
Related post:– Find cities with similar climate
Read MoreRelated post:– Find cities with similar climate
Read MoreThis map of comparing climates of the cities has been created using Global environmental stratification. The Global environmental stratification (GEnS) is based on statistical clustering of bioclimate data (WorldClim). GEnS consists of 125 strata, which have been aggregated into 18 global environmental zones (labeled A to R) based on the dendrogram
Read More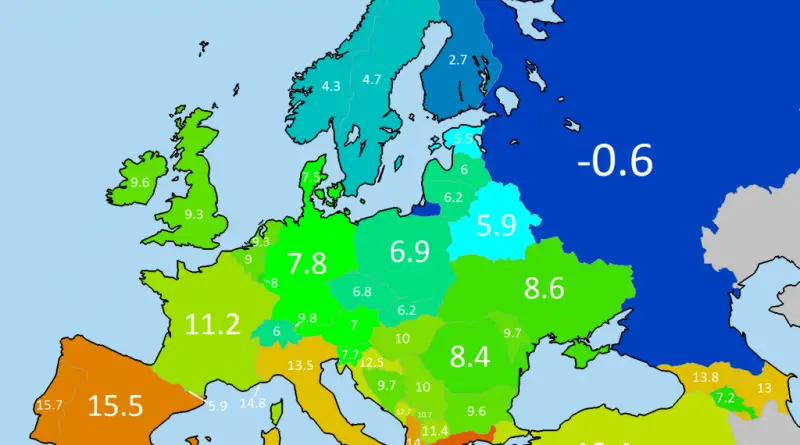
Related post: – Sum of average temperatures & suicides in Europe
Read More
Source: www.metricmaps.org/2017/11/02/who-pays-more-in-salary-us-state-or-federal-jobs
Read MoreTrade as % of U.S. state GDP 1 Michigan – 38.0% ($178 billion) 2 Louisiana – 35.1% ($84 billion) 3
Read MorePrecipitation varies widely across the United States, from a low of 2.3 inches per year in California’s Death Valley to
Read MoreReddit user: triton1982 Related posts: – Where Europe and Asia would fit in North America climate-wise – Climate analogues of
Read More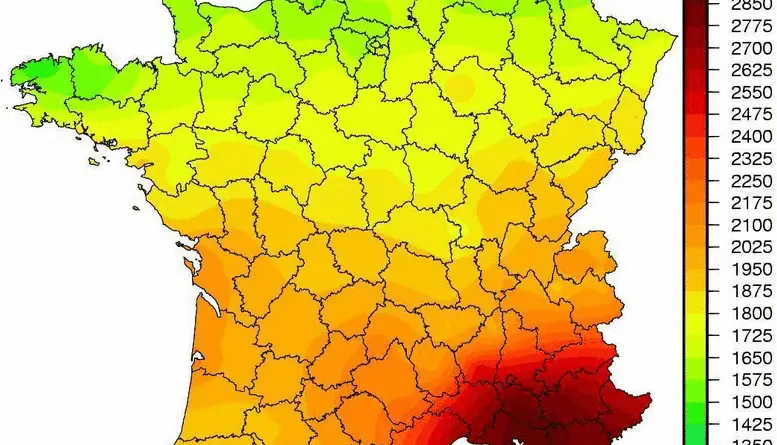
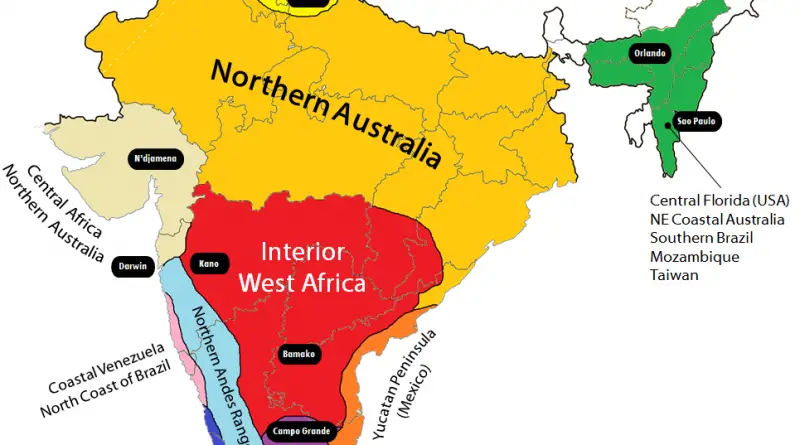
Each region of India climatically equivalent to the regions of the World whose names are overprinted, in the above map.
Read More