Life Expectancy of Subnational divisions
Explore how life expectancy has climbed from under 30 years in antiquity to 70+ today, uncover regional disparities, and peek at sub‑national maps that bring these trends to life.
Read More
Explore how life expectancy has climbed from under 30 years in antiquity to 70+ today, uncover regional disparities, and peek at sub‑national maps that bring these trends to life.
Read More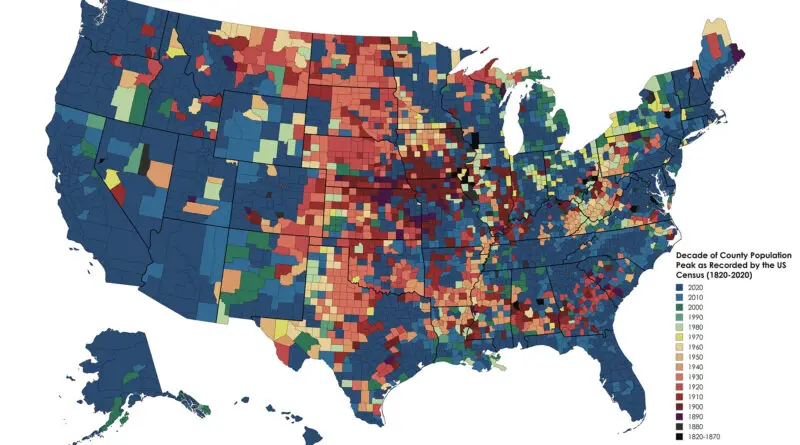
The demographic history of the United States is a rich tapestry woven with diverse threads of immigration, migration, settlement patterns, and socio-economic changes. Since its inception, the U.S. population has experienced dynamic shifts, shaped by various factors such as colonization, westward expansion, industrialization, and globalization.
Read More
Hispanic are Americans who are the posterity of immigrants from Spain or Latin America. Hispanics generally are the leading minority ethnic group in the U.S., after non-Hispanic white Americans. According to U.S. Census Bureau data, in 2020, Hispanics made up 18.7% (62.1 million) of the U.S. population.
Read More
Black Americans compose the 2nd-largest racial group in the United States, after White Americans and Hispanic Americans. African Americans make up 14.6% (47.8 million) of the U.S. population. In recent decades, there has been an increase in U.S. counties with a predominance of blacks.
Read More
More than half of the global population growth between nowadays and 2050 is expected to occur in Africa. Africa has the most significant rate of population increase among other continents.
Read More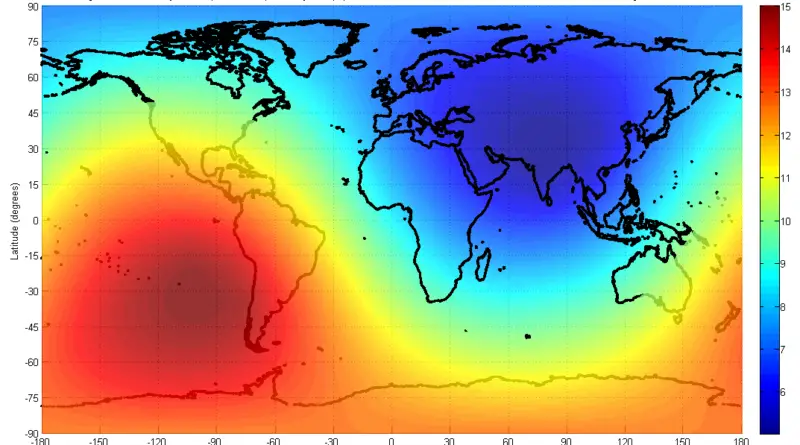
In demographics, the center of population is a geographical spot representing a center point of the region’s population. On average, the point nearest to everyone on our planet is in the north of South Asia, with a mean distance of 5,000 kilometers or 3,000 miles.
Read More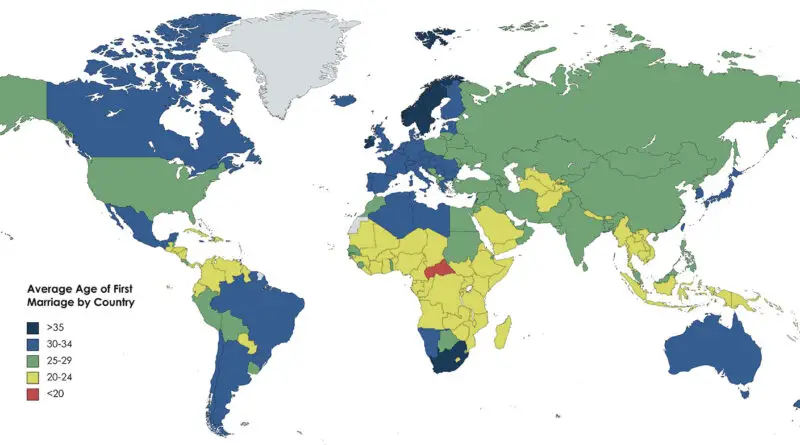
The average age of first marriage varies significantly from country to country. Cultural, social, and economic factors greatly determine when people choose to get married. In many Western nations, there has been a trend of people delaying marriage until later in life.
Read More
Today, the number of children aged 0-4 in the U.S. is 19.7 million. Between 2008 and 2020, the population aged 0-4 years in the United States was declining on average by 0.51 percent every year, although, before that, it rose from 16.6 million persons in 1979 to 21.1 million persons in 2008.
Read More
The U.S. population is distributed unevenly. The Census evaluates that in the U.S. population living across over 3,000 counties. A mere 140, or 4.5%, of U.S. counties, are home to approximately 50% of those people.
Read More
The population of kids aged 14 and under is about 61.4 million in 2020, representing 18.5 percent of the United States population. Population aged 0-14 years of the U.S. fell steadily from 26.9% in 1972 to 18.5% in 2020.
Read More