The Rising Cost of Land in the U.S. in the Past 40 Years
In 1975, all of the 48 contiguous states and DC had average land values below $15,000. But in 1976, starting
Read More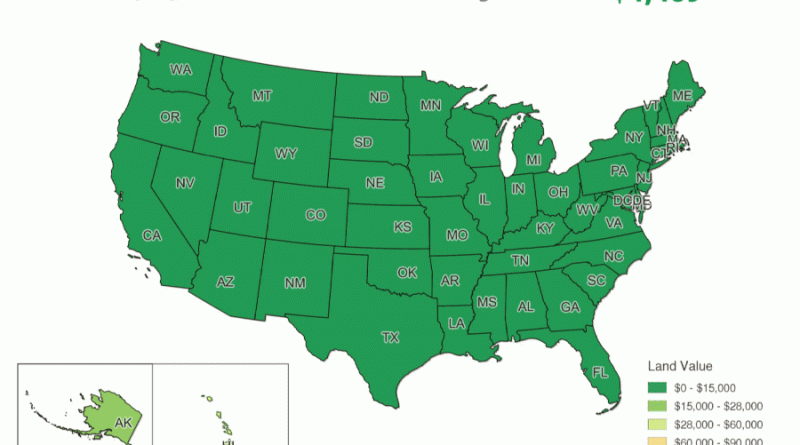
In 1975, all of the 48 contiguous states and DC had average land values below $15,000. But in 1976, starting
Read More40 percent of the buildings in Manhattan could not be built today. These are buildings that do not conform to New
Read MoreRelated posts: – San Francisco Hipsters – Where hipsters thrive and you can’t hide – San Francisco violent crimes, hot
Read Morewww.rentswatch.com/#!/city/berlin www.rentswatch.com/#!/city/paris European rent maps showing the average rental prices in 14 European cities – www.rentswatch.com/#!/city/.
Read MoreOne-bedroom prices with Year-over-Year changes shown. Relates posts: – Map of Manhattan by Joan Vinckeboons (1639) – A map of
Read MoreRelated posts: – What a difference 400 years makes (the London skyline 1616 – 2016) – London is the World’s
Read More2,396,750 road crashes in Great Britain mapped from 1999 to 2010.
Read MoreThe Post analysis, based on data from Black Knight Financial Services spanning 2004 through 2015, shows how the nation’s housing
Read More