According to the National Institute on Alcohol Abuse and Alcoholism (NIAAA), alcohol-related deaths have shown significant geographic variations across the United States. Let’s examine these patterns through an informative visualization:
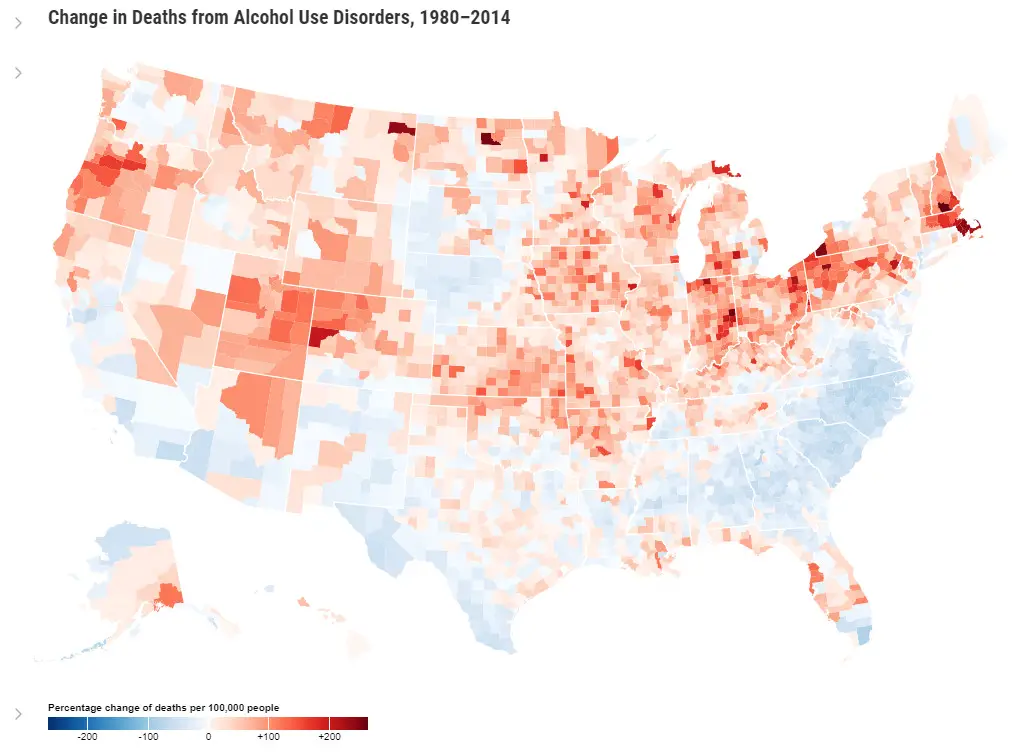
This detailed visualization, created by data scientist Mike Bostock, presents the percentage change in deaths per 100,000 people due to alcohol use disorders between 1980 and 2014. The map reveals striking regional variations across the United States over these 34 years.
Looking at the long-term trends shown on the map, several notable patterns emerge:
Significant decreases (shown in blue) occurred in:
California south of the Bay Area
Southern Arizona
Southern New Mexico
Southern Texas
Virginia
North and South Carolina
Georgia
Albany
Most other regions experienced increases
Massachusetts showed particularly pronounced increases (shown in red).
These long-term trends spanning over three decades provide valuable insights into regional differences in public health outcomes and the effectiveness of various state-level policies and interventions.
Recent data from the CDC paints an alarming picture. According to the National Center for Health Statistics report, alcohol-induced deaths increased dramatically from 2019 to 2020. The age-adjusted death rate rose by 26%, with males experiencing significantly higher rates (18.6 per 100,000) compared to females (8.0). The increase was particularly notable among adults aged 25-54.
The timing of this sharp increase coincided with the COVID-19 pandemic, which fundamentally changed many aspects of daily life. Several factors contributed to this concerning trend:
The pandemic brought:
Prolonged isolation during lockdowns
Limited access to in-person support groups and treatment
Increased stress and anxiety
Job losses and financial uncertainty
Changes in alcohol accessibility through expanded delivery services
These challenges compounded existing issues with alcohol use across the country. While the historical map shows some regions made significant progress in reducing alcohol-related deaths between 1980 and 2014, particularly in parts of California, Texas, and the Southeast, today’s nationwide increase in mortality rates calls for renewed attention to this public health crisis.
Some regions’ successful approaches to reducing alcohol-related deaths offer valuable insights. Communities that achieved significant reductions often implemented comprehensive strategies including:
Improving access to healthcare and treatment programs
Building strong support networks
Funding evidence-based prevention programs
Providing extensive public health education
Creating accessible treatment options
If you’re concerned about alcohol use – whether for yourself or someone else – it’s important to recognize early warning signs of alcohol use disorders:
Drinking more or longer than intended
Difficulty controlling or cutting down alcohol consumption
Experiencing withdrawal symptoms when not drinking
Needing to drink more to get the same effect
Continuing to drink despite problems with relationships or work
Giving up activities you once enjoyed in favor of drinking
Understanding your risk factors is equally important:
Family history of alcohol use disorders (genetics play a significant role)
Personal history of mental health conditions
Early age of first alcohol use
Trauma or high-stress levels
Environmental factors like social pressure or easy alcohol access
Several proven support options are available:
Consult your healthcare provider for personalized guidance and screening
Join local support groups for community-based help
Contact SAMHSA’s National Helpline at 1-800-662-4357 for 24/7 confidential support
Access treatment programs through your state health department
The combination of historical data and recent trends demonstrates that while this is a complex public health challenge, positive change is possible through coordinated individual and community efforts.
If you’re interested in exploring these geographic patterns further, consider these educational map resources available on Amazon: