When you picture the workforce in the United States, it’s easy to imagine a uniform sea of salaries and jobs. But in reality, where you live makes a major difference—especially when it comes to low-wage work.
Today, about 30.6 million Americans, or 21% of the workforce, earn less than $17 an hour. This threshold is important because it matches the goal set by the proposed Raise the Wage Act of 2023, which aims to lift the federal minimum wage to $17 by 2028.
The map above paints a clear picture: low-wage work isn’t spread evenly across the U.S. Some states are grappling with far higher shares of low-paid workers than others.
Where Low-Wage Work is Most Common
The South stands out with the highest concentration of low-wage workers. At the top of the list is Mississippi, where an astonishing 41% of the workforce earns under $17 per hour. Mississippi has no state-level minimum wage, meaning it defaults to the federal baseline of $7.25 per hour—a rate that has remained frozen since 2009.
States following closely behind include Louisiana (37%), Oklahoma (36%), and West Virginia (35%). They also have relatively low living costs, but their economic issues involve slower growth, lower productivity of the workforce, and slower wage growth over the past few decades.
On the other end of the spectrum, Washington has the lowest share of low-wage workers at 12%. That’s no accident: Washington’s minimum wage rose to $16.28 in 2024.
How Policy and Geography Affect Wages
The regional variation is not coincidental. It is highly correlated with state-level policy, economic expansion, and even cultural factors. States that set their own higher minimum wages—like California, New York, and Washington—have lower percentages of low-wage workers.
Conversely, states that are forced to rely on the federal minimum wage have a larger percentage of low-wage jobs, especially in service industries like retail, hospitality, and food services.
Economic efficiency plays a role too. Mississippi, for example, has the lowest GDP per worker in the nation, limiting the ability of businesses to pay higher wages. All of this shows how intertwined location, law, and economic well-being are when it comes to wages.
A Glimmer of Progress
Despite these challenges, there are reasons for optimism. From 2019 to 2023, low-wage workers experienced a 12.1% increase in real wages. That’s a big shift from decades of stagnant wage growth.
During this time, 29 states raised their minimum wages through new laws, ballot measures, or automatic adjustments. The share of low-wage workers has dropped from over 30% in 2013 to 21% today, after adjusting for inflation.
Still, the uneven distribution of low-wage work remains a challenge—especially for states that haven’t moved to raise their minimum wages or stimulate more productive industries.


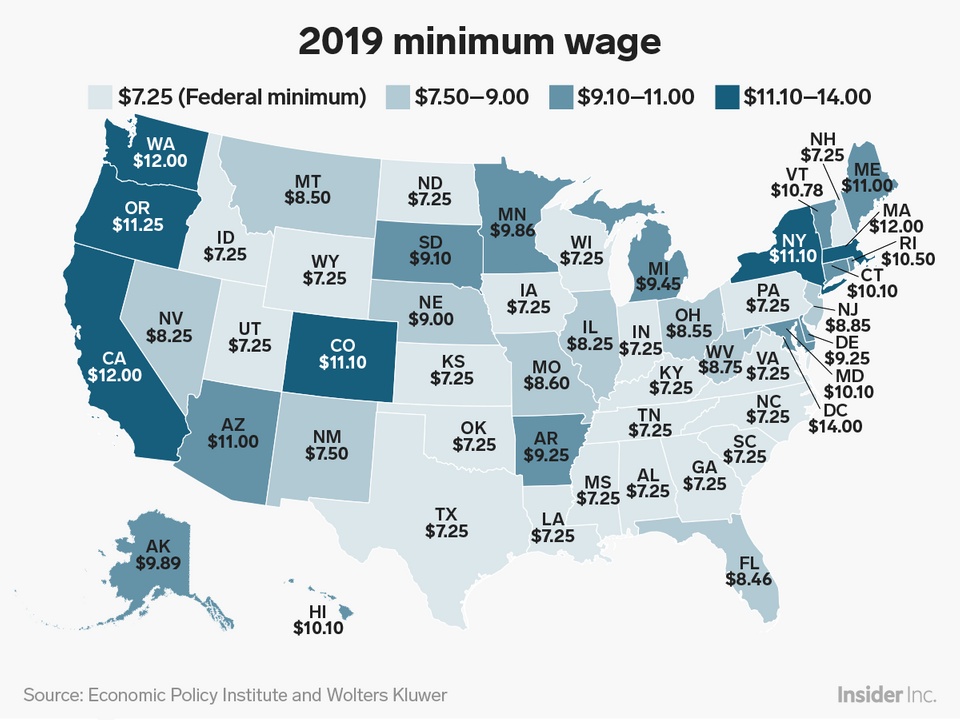
Minimum Wages across the United States (2019)