Firearms have shaped American society since the nation’s founding, playing a role unlike anywhere else in the world. The Second Amendment’s guarantee of the right to bear arms has transformed guns from mere tools into powerful symbols of American liberty and identity.
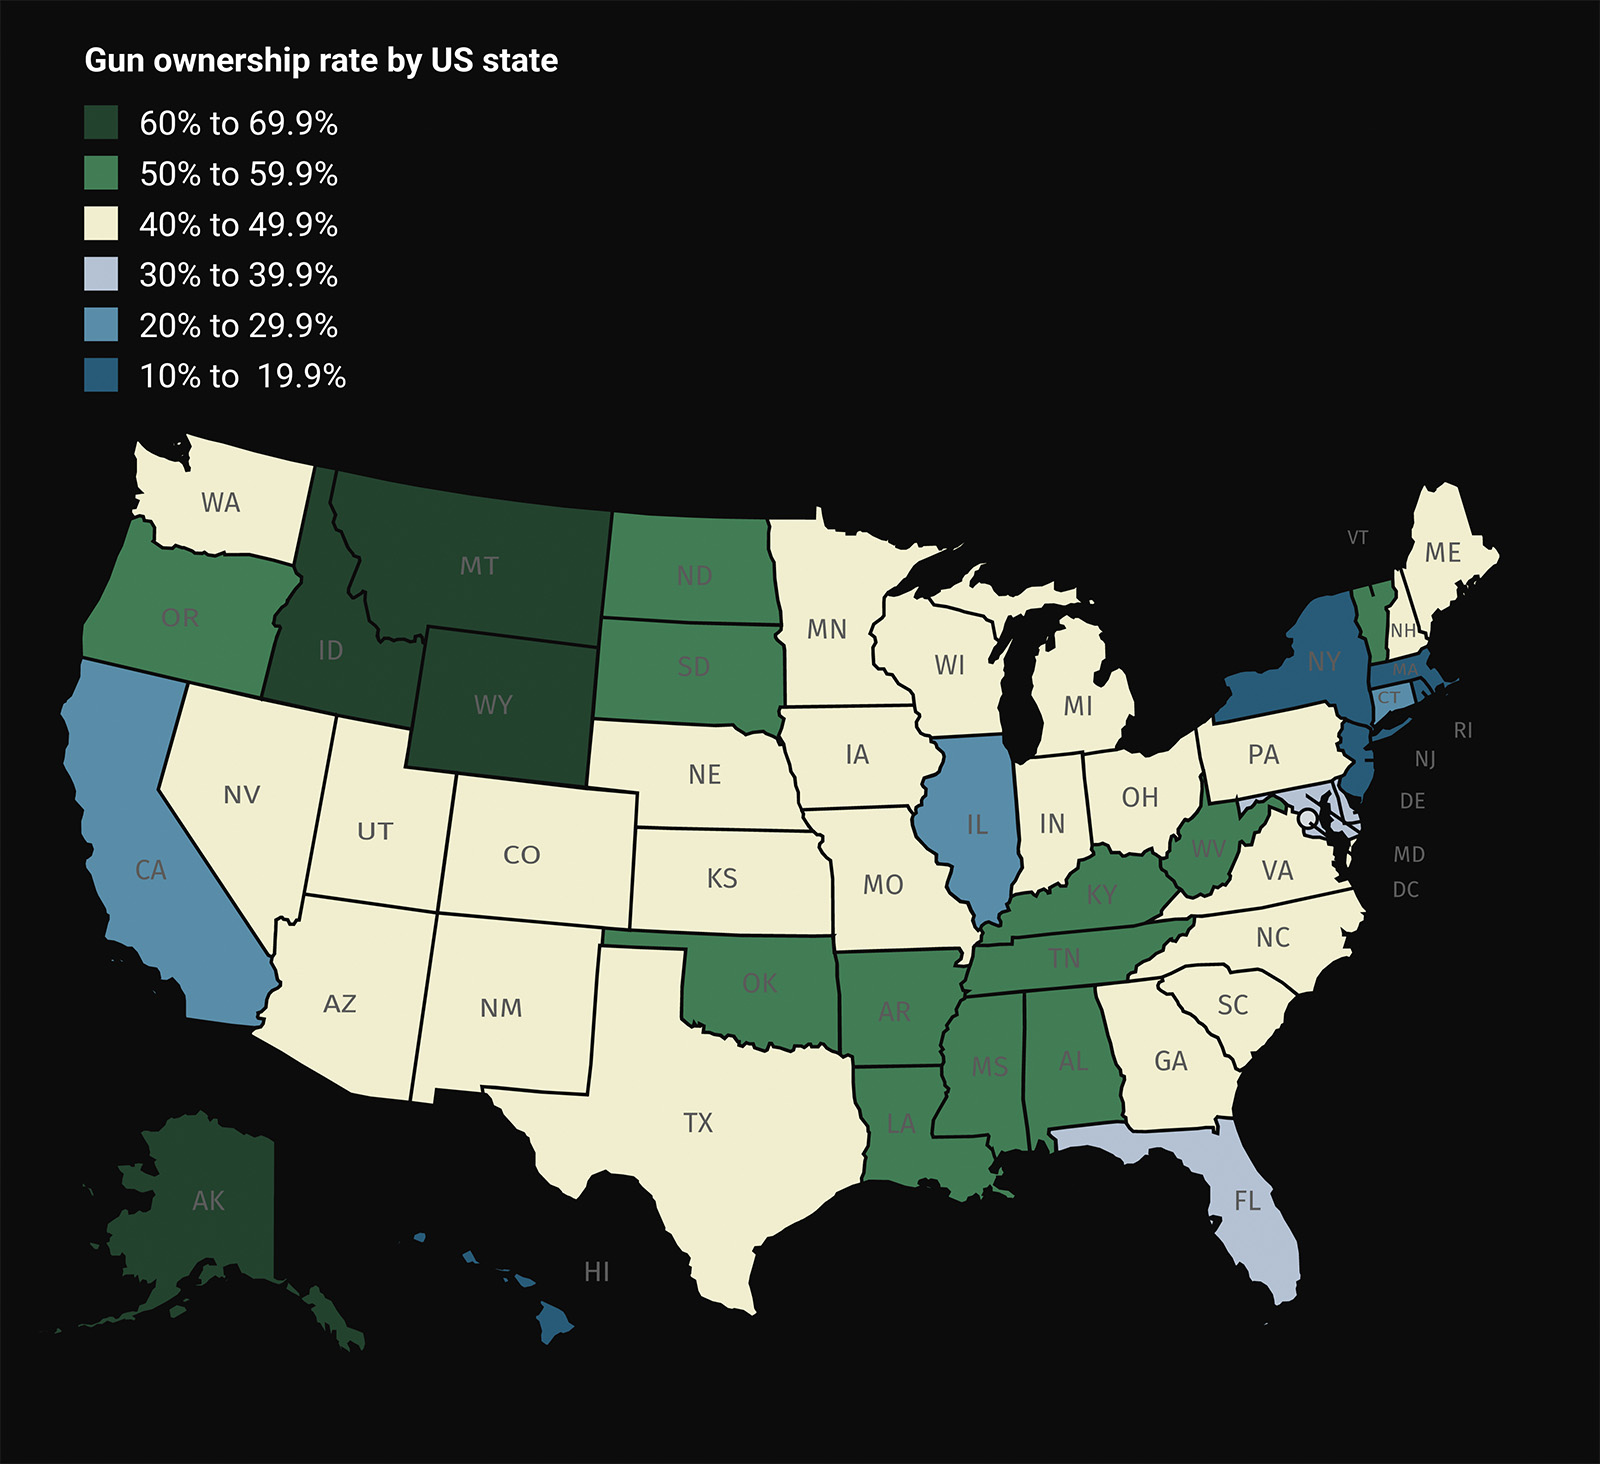
Map showing the percentage of gun ownership by US state. Data source: Small Arms Survey, 2022
Recent studies paint a striking picture of firearm ownership in America. Research from the National Firearms Survey shows that between 37% and 47% of American households have owned at least one firearm since 1972, with the most recent data showing approximately 45% of households having a gun in 2022.
The Small Arms Survey provides even more remarkable statistics: Americans collectively own about 393 million firearms, averaging 120.5 guns per 100 residents. To put this in perspective, that’s more guns than people – a situation unique among developed nations.
According to the Pew Research Center, 42% of U.S. adults reported living in a household with a gun, and about 30% of U.S. adults reported personally owning a gun.
State-by-State: America’s Gun Ownership Landscape
Gun ownership rates vary dramatically across the United States, creating distinct regional patterns that reflect local cultures, traditions, and regulations. Data from the Bureau of Alcohol, Tobacco, Firearms, and Explosives helps illustrate these patterns.
States with Highest Gun Ownership Rates
Wyoming: 195.7 guns per 100 residents
District of Columbia: 66.4 guns per 100 residents
Arkansas: 58.4 guns per 100 residents
Idaho: 56.9 guns per 100 residents
West Virginia: 54.2 guns per 100 residents
Alaska: 52.3 guns per 100 residents
Mississippi: 50.8 guns per 100 residents
Alabama: 49.9 guns per 100 residents
North Dakota: 47.9 guns per 100 residents
Montana: 47.4 guns per 100 residents
States with Lowest Gun Ownership Rates
Delaware: 5.2 guns per 100 residents
Rhode Island: 5.8 guns per 100 residents
New York: 10.3 guns per 100 residents
New Jersey: 12.3 guns per 100 residents
Massachusetts: 14.3 guns per 100 residents
Connecticut: 16.6 guns per 100 residents
Maryland: 17.3 guns per 100 residents
Hawaii: 20.7 guns per 100 residents
California: 20.8 guns per 100 residents
Illinois: 22.6 guns per 100 residents
American States vs. The World
Map comparing US states’ total gun ownership to other countries. Data source: Small Arms Survey, 2022
When comparing American states to entire nations, the numbers are striking. Harvard Injury Control Research Center research shows that even US states with relatively low gun ownership rates often surpass entire nations in terms of firearms per capita.
Among other nations, only a few come close to American levels of civilian gun ownership:
Yemen: With an estimated 50-60 firearms per 100 people, Yemen ranks high globally, though ongoing conflicts have complicated accurate counting, according to the United Nations Office on Drugs and Crime.
Switzerland: Thanks to its militia system, Switzerland maintains about 27 firearms per 100 people, as reported by the Swiss Federal Statistical Office.
Finland: With 17-20 firearms per 100 people, Finland’s strong hunting tradition contributes to its relatively high ownership rate, as documented by Statistics Finland.
Understanding America’s Gun Culture
Several key factors shape the American relationship with firearms:
Constitutional Foundation: The Second Amendment continues to influence both legal frameworks and cultural attitudes toward gun ownership.
Regional Variations: State laws create significant differences in gun accessibility and regulation.
Demographics: According to Gallup’s latest gun ownership survey, ownership patterns follow distinct demographic lines, with higher rates among men, rural residents, and conservatives.
The Congressional Research Service provides comprehensive analysis of how gun ownership patterns have evolved over time, showing significant regional and demographic shifts in recent decades.
What’s your experience with firearm ownership in your state? Have you noticed changes in local gun culture over time? Share your thoughts in the comments below.