Guns have long been embedded in American culture. From the right to bear arms enshrined in the Second Amendment to the ongoing political battles over gun control, firearms remain one of the most polarizing issues in the United States. But the relationship between gun ownership, gun violence, and state gun laws is anything but simple.
Three fascinating maps reveal this complex dynamic — highlighting how gun violence, gun ownership rates, and gun laws vary dramatically across the country. Let’s take a closer look at what the data reveals.
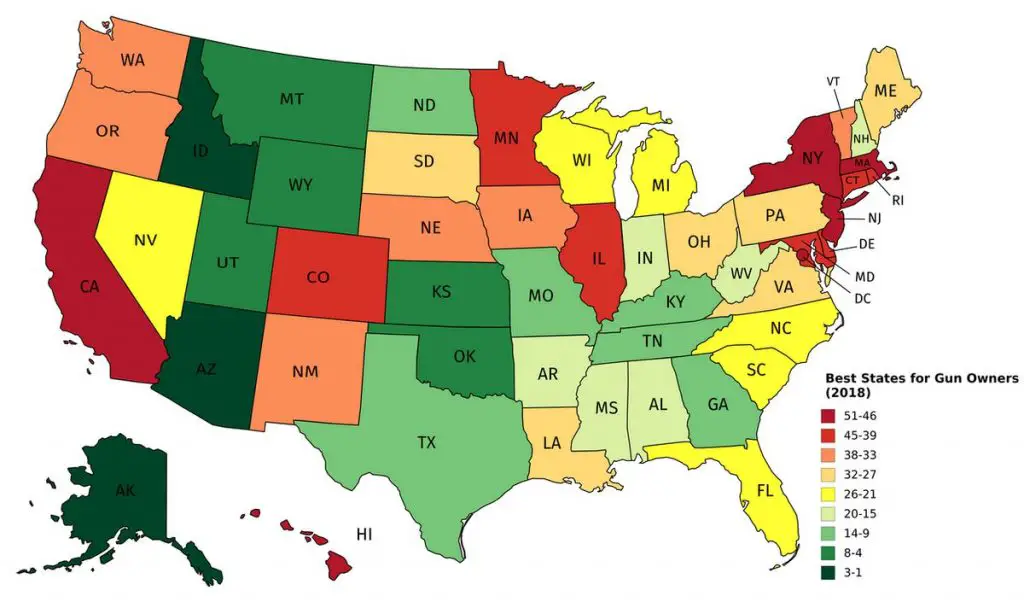
The Best and Worst States for Gun Owners
The first map, compiled by Guns & Ammo editors, ranks the best and worst states for gun owners based on five key factors:
Right to Carry
Access to “Black Rifles” (assault-style weapons)
Use-of-force laws
Prohibition of items regulated by the National Firearms Act
A catch-all “Miscellaneous” category
The top 10 gun-friendly states reflect a clear regional pattern. The Mountain West and the South dominate the list, with states like Arizona, Idaho, Alaska, and Wyoming consistently ranking high for gun owner rights.
Top 10 Best States for Gun Owners:
Arizona
Idaho
Alaska
Kansas
Wyoming
Oklahoma
Utah
Montana
Texas
Georgia
On the other hand, the least gun-friendly states tend to be in the Northeast and on the West Coast. New York, New Jersey, and California rank poorly, with strict regulations on carrying, ownership, and assault-style weapons.
Top 10 Worst States for Gun Owners:
New York
New Jersey
Massachusetts
Hawaii
Washington, D.C.
California
Connecticut
Maryland
This paints a clear picture of where gun owners have the most — and least — freedom. But how does that translate into actual gun ownership?
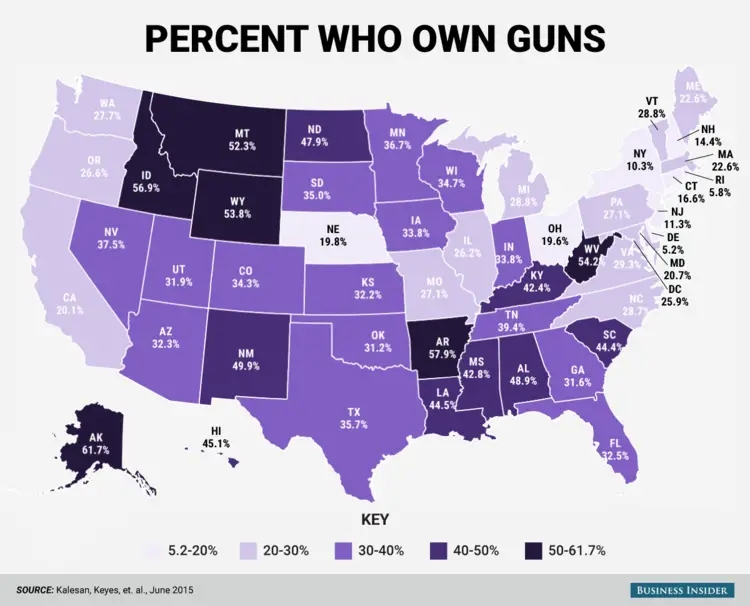
Who Owns the Guns?
Legal access to guns doesn’t always mean that people are actually buying and owning them. The second map, created by Business Insider, shows the percentage of residents who own guns in each state.
The highest gun ownership rates are found in rural states with strong hunting traditions and fewer urban centers:
Alaska – 61.7%
Arkansas – 57.9%
Idaho – 56.9%
Meanwhile, the lowest rates are concentrated in the densely populated Northeast and urbanized parts of the West Coast:
Delaware – 5.2%
Rhode Island – 5.8%
New York – 19.9%
Not surprisingly, some of the most gun-friendly states — like Alaska and Idaho — also have some of the highest ownership rates. States with low gun ownership, such as New York and Massachusetts, also tend to have strict gun laws and low gun homicide rates.
Interestingly, some states with high gun ownership also have relatively low homicide rates. For example, Vermont has a gun ownership rate above 40% but a gun homicide rate below 1 per 100,000. This hints that other social and economic factors — not just gun access — might be influencing violence levels.
But do high ownership rates or loose gun laws necessarily lead to more gun violence? Let’s take a look at the data on gun homicides.
Where Gun Violence Hits Hardest
The third map, created by Reddit user academiaadvice, shows the average gun homicide rate per 100,000 residents in each U.S. state from 2007 to 2016.
The national average during this period was 3.8 gun homicides per 100,000 people, but the variation between states is staggering.
At the top of the list is Washington, D.C., with an alarming rate of 14.4 gun homicides per 100,000 people — nearly four times the national average. The high rate in D.C. is likely influenced by a combination of urban poverty, illegal firearm trafficking, and social instability.
High gun homicide rates are concentrated in the Deep South and Mid-Atlantic regions:
Louisiana – 9.9
Mississippi – 7.8
Alabama – 7.0
Maryland – 5.9
Meanwhile, some of the safest states are in the Northeast and Upper Midwest:
Vermont – 0.9
Hawaii – 0.6
New Hampshire – 0.6
At first glance, you might expect that states with looser gun laws would have higher levels of gun violence — but the data tells a more complicated story.
Some states with high gun ownership rates, like Wyoming and Montana, have relatively low homicide rates. And some states with strict gun laws, like Illinois and Maryland, still have high levels of gun violence, particularly in urban areas.
This suggests that gun violence isn’t solely about access to guns. Other factors, such as poverty, crowded cities, and social tensions, likely play an equally important role.
Guns, Laws, and Violence – A Complex Relationship
What’s most notable about these maps is the lack of a clear, consistent pattern linking gun laws, ownership rates, and gun homicides. Here’s what stands out:
High gun ownership ≠ high gun homicides. Vermont, with a gun ownership rate of over 40%, has a homicide rate below 1 per 100,000.
Strict gun laws ≠ low gun violence. Illinois has some of the toughest gun laws in the country but still sees significant gun violence, particularly in Chicago.
Regional differences matter. The South and Mountain West tend to have higher gun ownership and higher gun homicide rates, while the Northeast combines low ownership and low violence.
This suggests that gun violence is influenced not just by access to firearms, but by a complex web of social, economic, and cultural factors. Factors like poverty, crowded cities, and social tensions likely play just as big a role as gun laws themselves.
Final Thoughts
Guns are a deeply rooted part of American culture, but the data shows that the relationship between gun ownership, gun laws, and violence is far from simple. The same state can have loose gun laws, high gun ownership, and low homicide rates — or the opposite.
What’s your take? Do stronger gun laws lead to less violence, or are other factors at play? Let me know your thoughts in the comments below.