Overall, 66.7% of the Americans’ whole homeless population is single people, with the leftover 33.3% being families. In recent years, homelessness has grown nationwide by almost 1%.
About 35% (just under 200 thousand) are found sleeping unsheltered on streets in places not meant for human habitation (abandoned houses, cars, sidewalks, parks). At the same time, above 350 thousand of sheltered homeless people are found in emergency shelters and transitional housing programs.
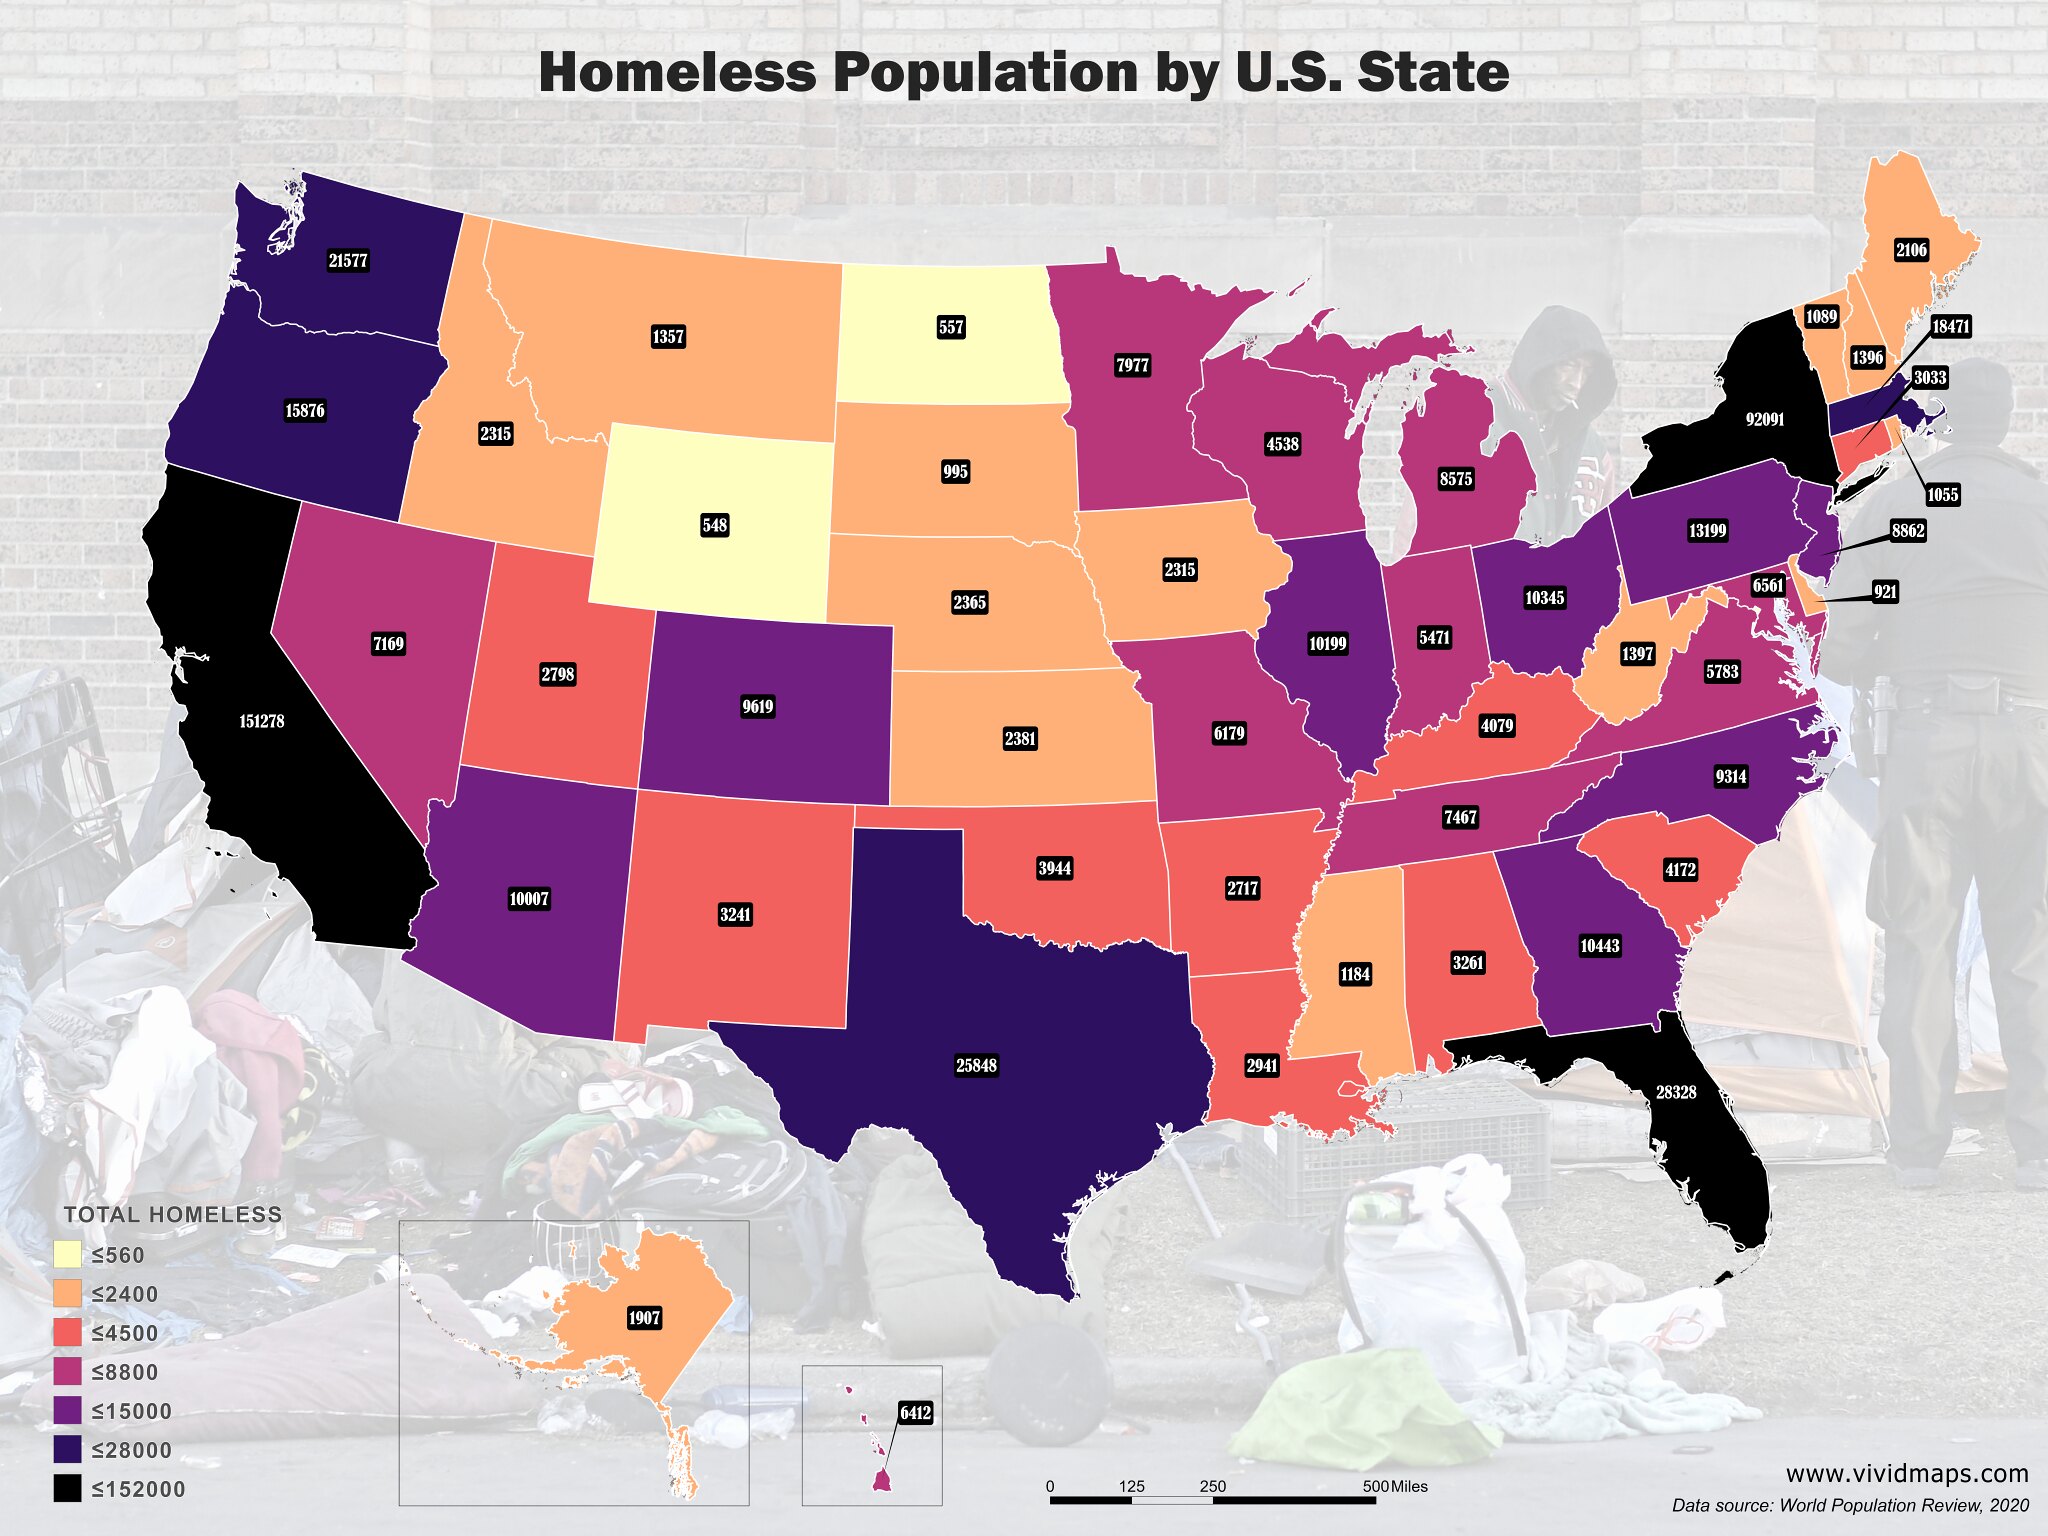
Homeless Population by State 2020
The state of California at present has the highest homeless population, with approximately 160 thousand homeless people. It is about 1/5 of all homeless people and 47% of all unsheltered homeless people in the U.S. (~4 times as high as their share of the overall U.S. population).
Amongst the 5 cities with the highest rates of unsheltered homelessness, 4 are in California (San Francisco, Los Angeles, Santa Rosa, and San Jose), and the other is Seattle. The 3 cities with the highest sheltered homelessness rates are all found in the Northeast region: New York City, Boston, and Washington, D.C. The rate of sheltered homelessness in every one of these cities is over 2.7 times as high as in San Francisco, the city with the 4th highest sheltered homelessness rate. New York City alone has over 1/5 of all sheltered homeless people in the U.S.
At present, homelessness in NYC touched the highest levels since the Great Depression in the 1930s.
Here are the 20 states with the most homeless people:
California – 151,278
New York – 92,091
Florida – 28,328
Texas – 25,848
Washington – 21,577
Massachusetts – 18,471
Oregon – 15,876
Pennsylvania -13,199
Georgia – 10,443
Ohio – 10,345
Illinois – 10,199
Arizona – 10,007
Colorado – 9,619
North Carolina – 9,314
New Jersey – 8,862
Michigan – 8,575
Minnesota – 7,977
Tennessee – 7,467
Nevada – 7,169
Maryland – 6,561
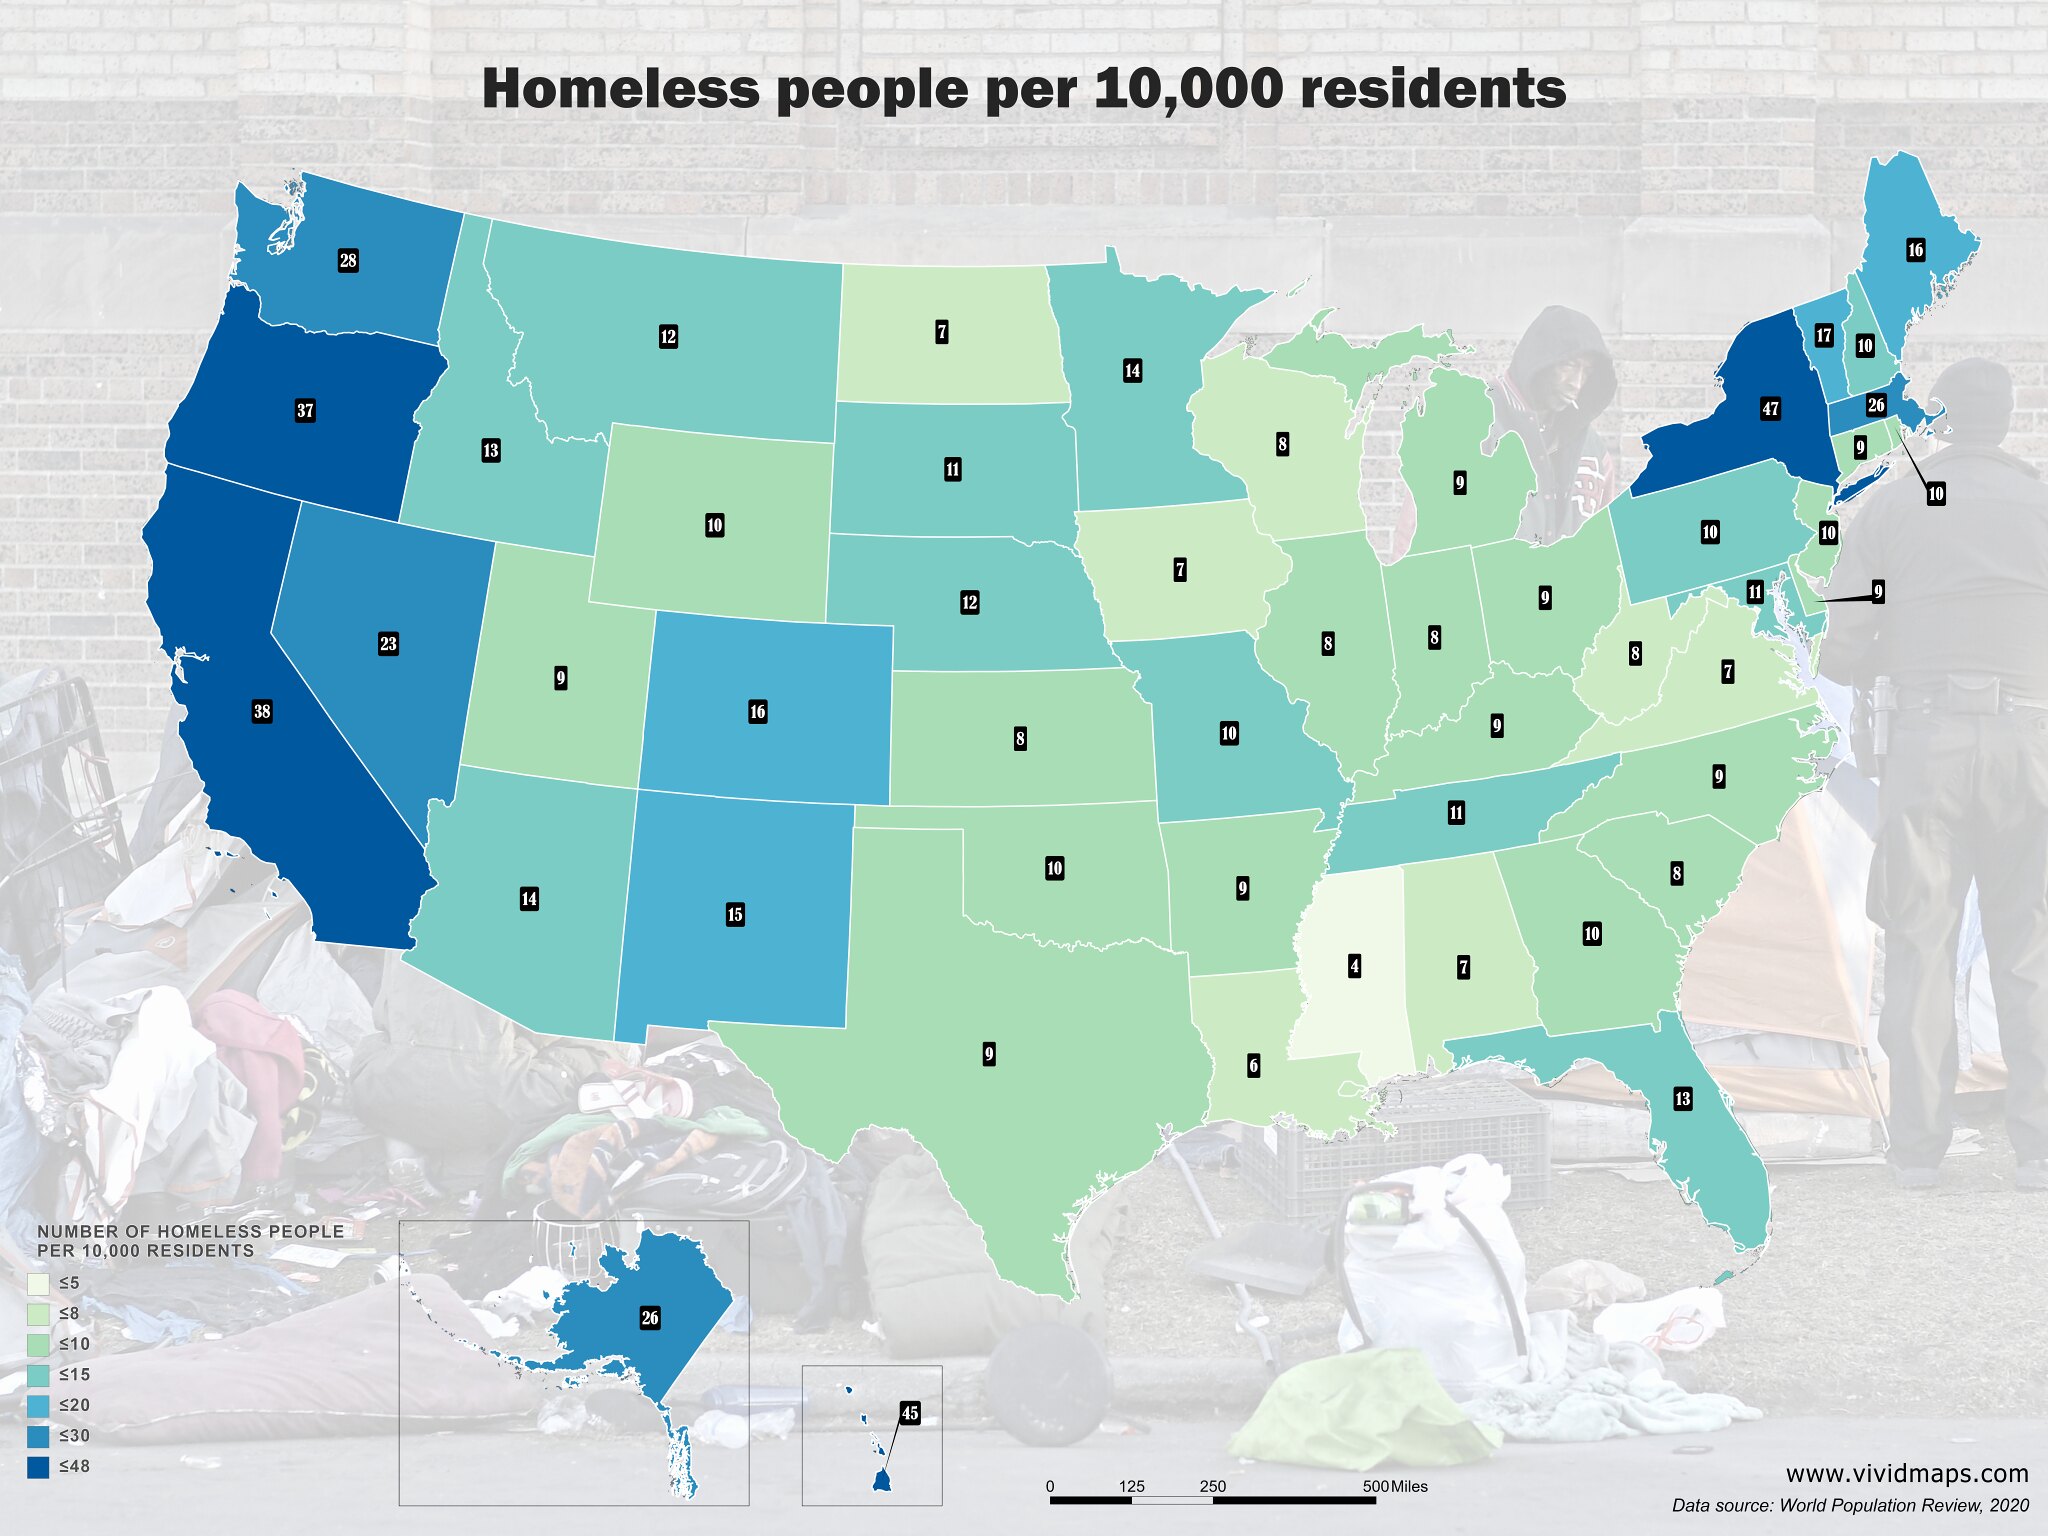
Number of homeless people per 10,000 residents
The U.S. States with the highest overall rates of homelessness per 10,000 are New York (47 homeless per 10,000 residents), Hawaii (45 homeless per 10,000 residents), California (38 homeless per 10,000 residents), and Oregon (37 homeless per 10,000 residents).
The density of the homeless population
The States with the highest density of the homeless population are Massachusetts (56.8 homeless per square mile) and New York (46.88 homeless per sq.mi.).
The map created by Reddit user BacteriaEP shows the number of homeless per 100,000 people and the percent of homeless who are unsheltered. It clearly shows why homelessness is so much more visible on the west coast.
Wolf
1 year ago
How do you know? Who did the survey. What is the validity and reliability, based upon what measuring instrument. I want to see the source data. I can help.
I am a social psychologist, mainly sociologist, veteran about to be homeless, by choice. Yet I can be participant observer. The world is my office, put me to work. I can create my own survey and submit to the human subjects committee. As an active sociologist I can spend as much time in ‘camp’ as needed. You need me, I don’t need you. I will focus on veterans. I will accept suggestions. I believe in the value of open ended questions.
Challenge?