Brazil’s homicide numbers are staggering. Around sixty thousand people are murdered here every year. The United States records fewer. China records fewer. Canada, Australia, New Zealand, most of Europe—Brazil exceeds all of them combined. UN data puts Brazil at 21.3 per 100,000 in 2021, about four times the world average.
In the mid-2010s, Brazil’s yearly total surpassed what 79 other countries recorded together. Not scattered small nations—entire regions of the planet.
Where Brazil stands globally
Seventy-nine countries each recorded fewer homicides than Brazil in a selected year. The United States, China, Canada, Australia, New Zealand, most of Europe, North Africa, Central Asia (Uzbekistan, Tajikistan), Southeast Asia, southern Africa, Latin America—all on that list. Brazil’s violence outpaces most of the world.
Brazilian states versus U.S. states and European provinces
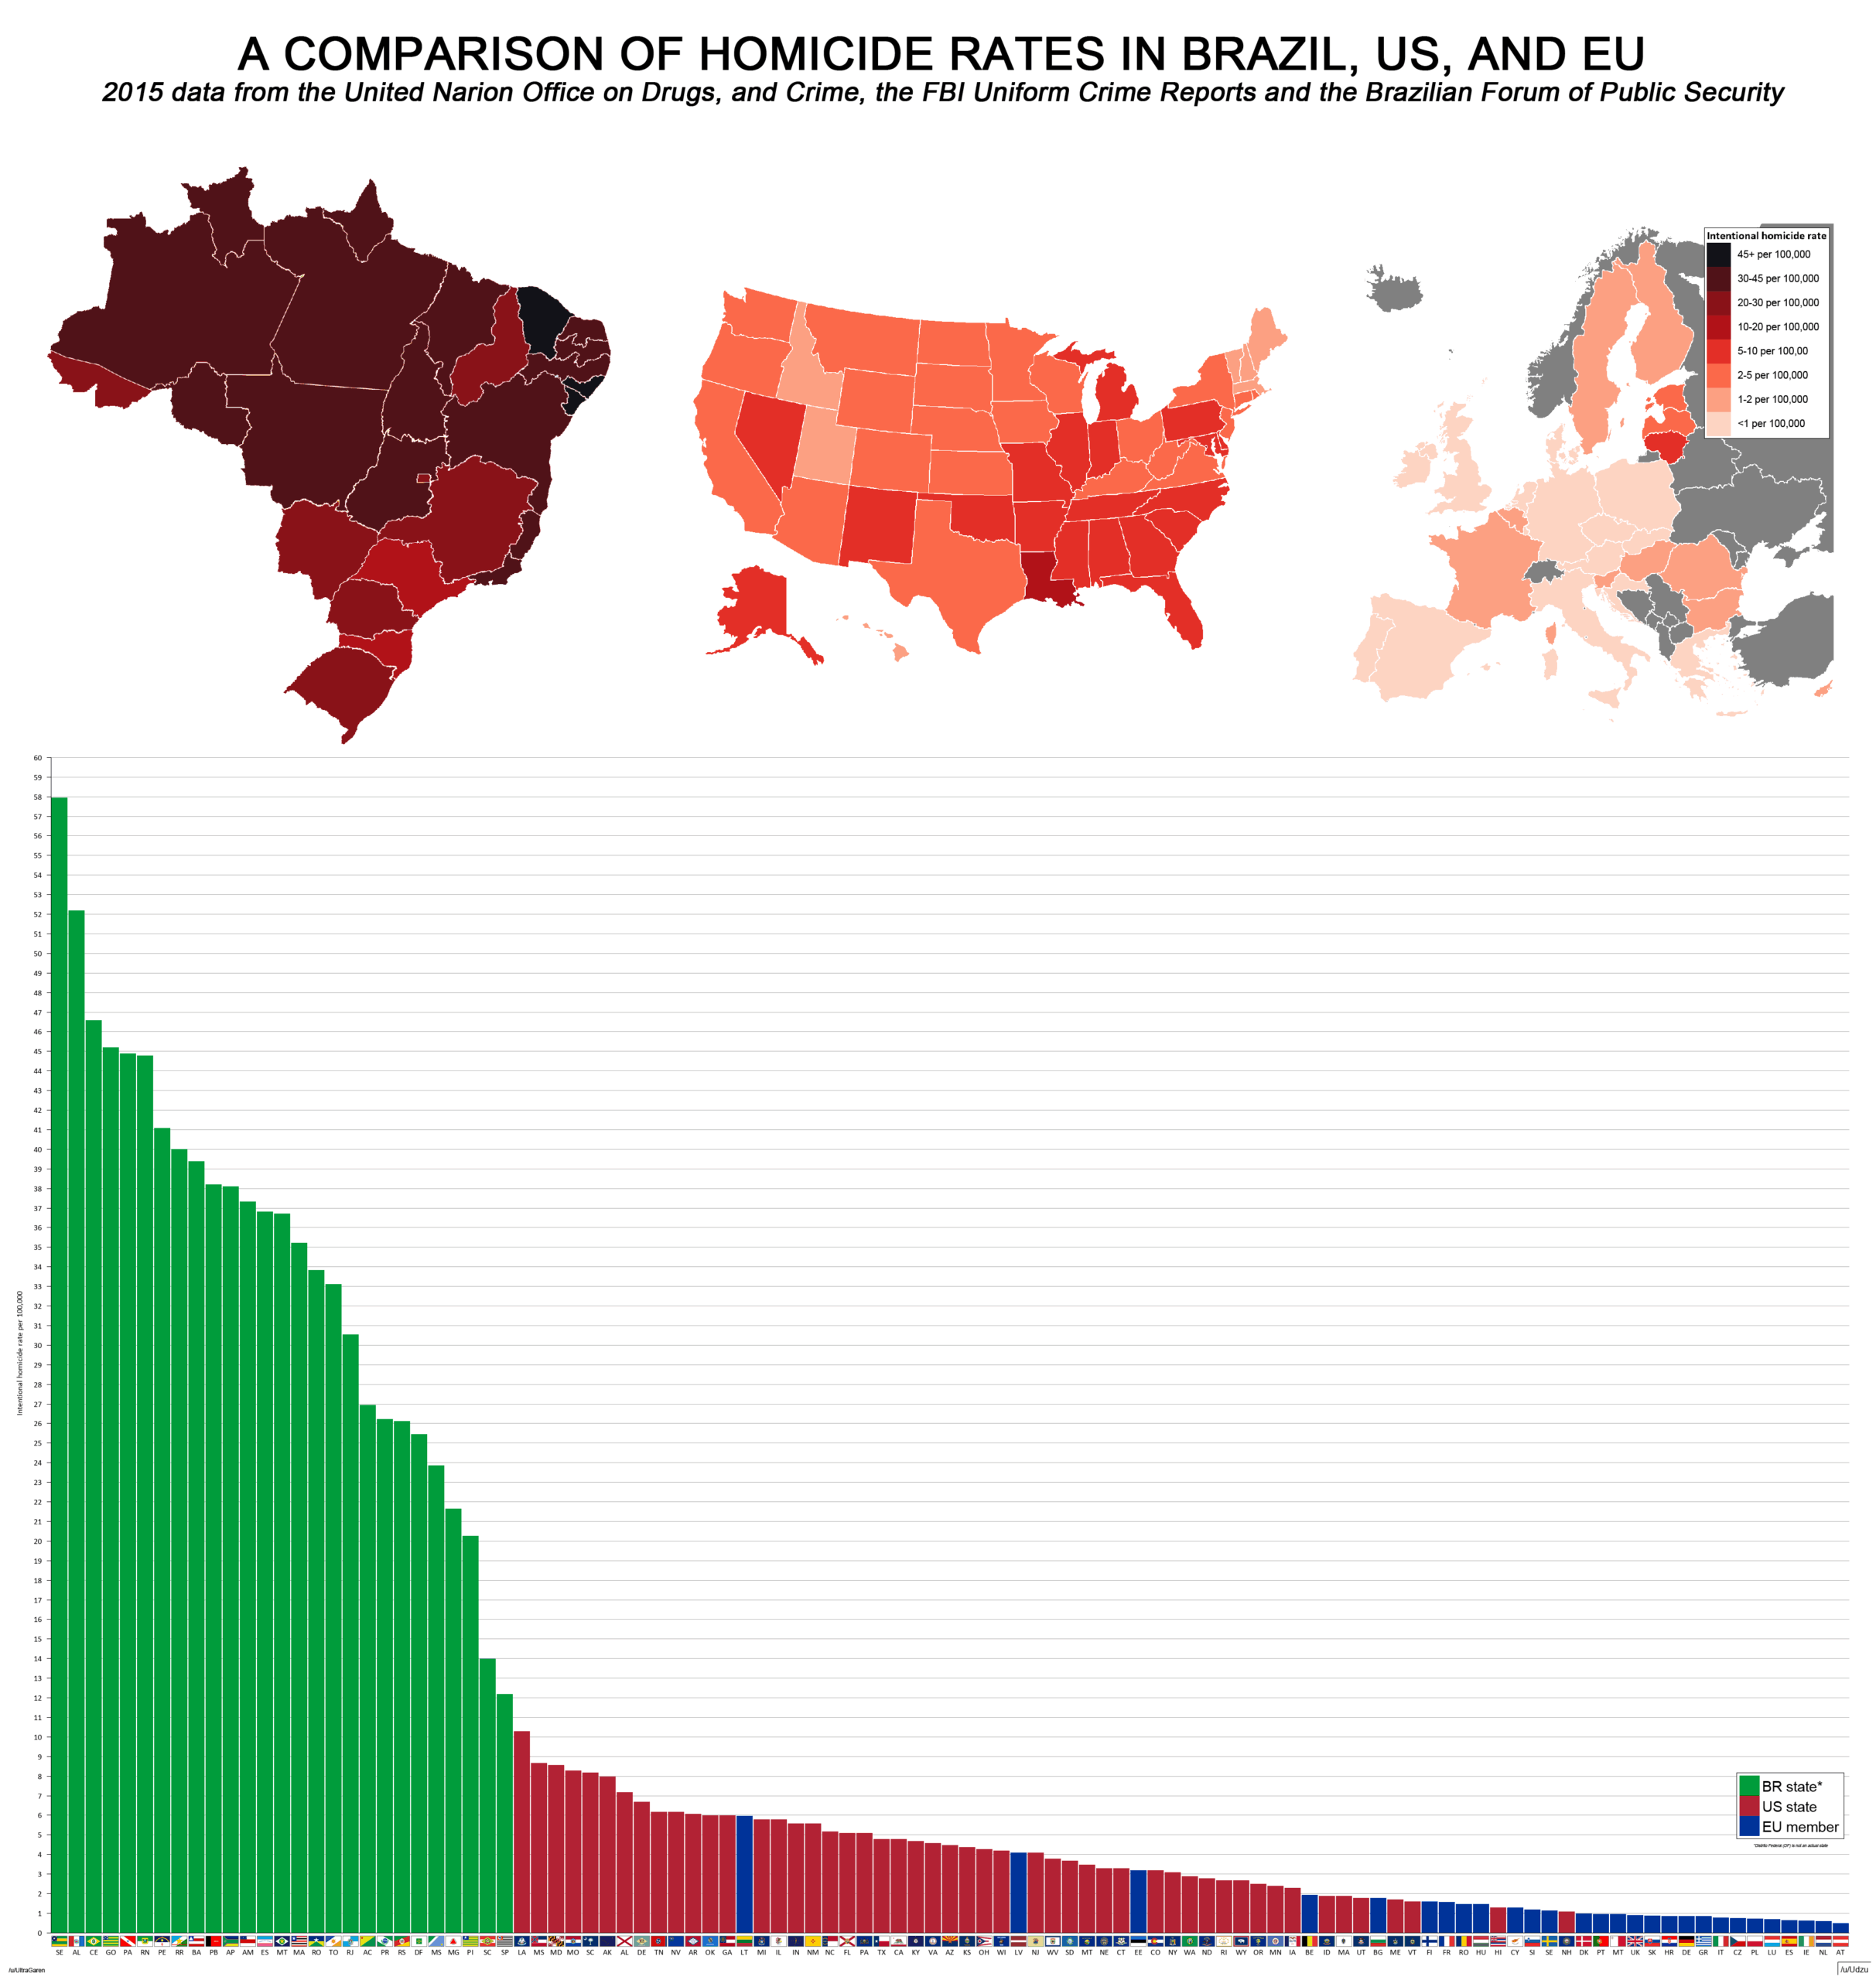
The map below, created by a Reddit user FritzDarges shows homicide rates by province in Brazil, the United States, and the European Union.
Compare Brazilian states with American states and European provinces. Most U.S. states have rates several times lower. European provinces are safer still—ten to fifteen times lower than Brazil’s worst areas. Very few Brazilian states match even the safer parts of America.
Which states had the worst rates in 2021?
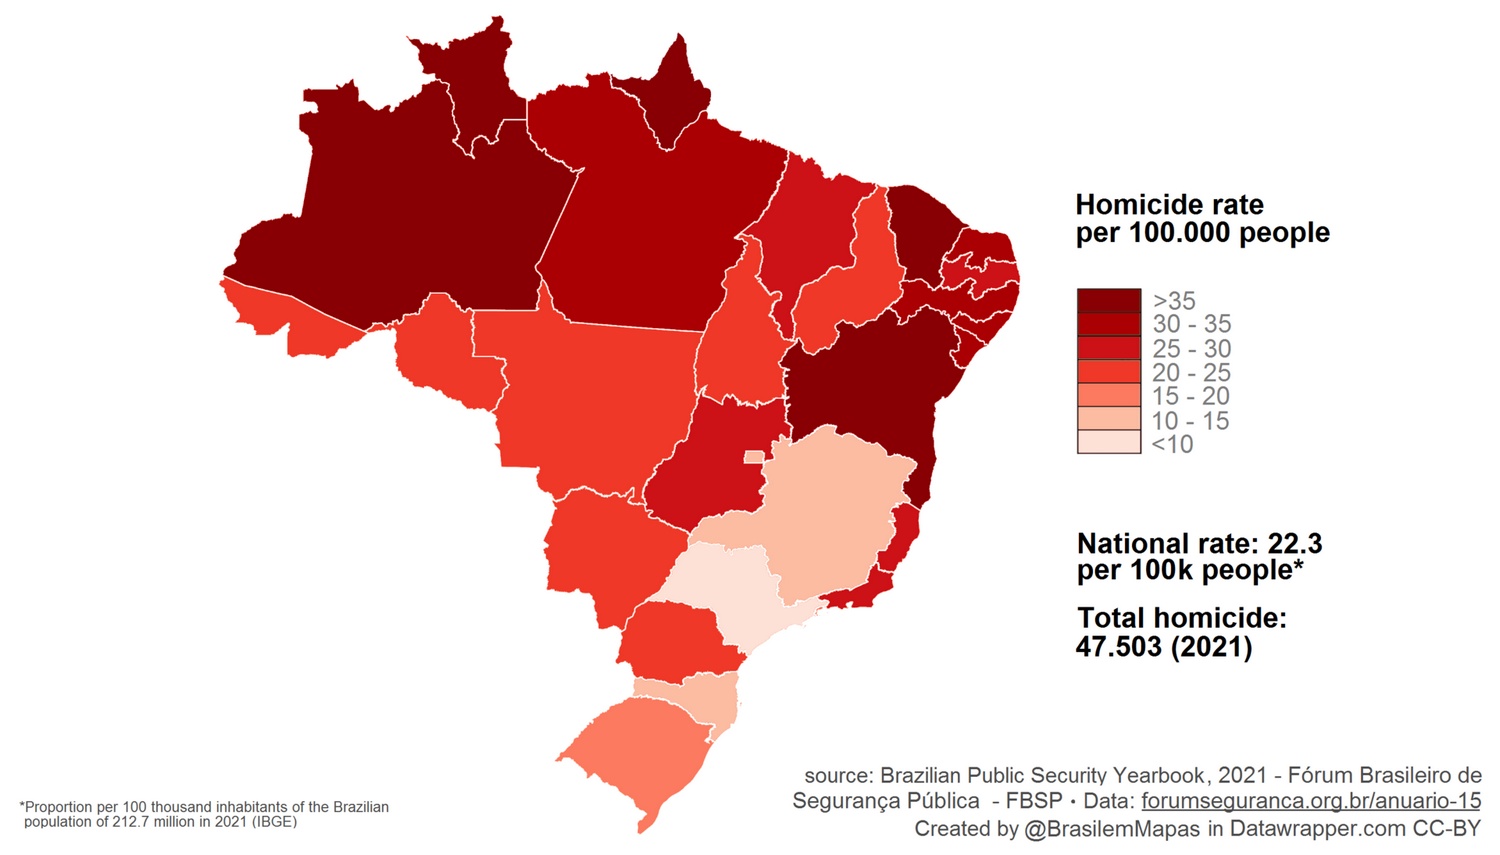
Amapá: 53.8 per 100,000. Bahia: 44.9. Amazonas: 39.1. Ceará: 37.0. Roraima: 35.5. War zone numbers.
São Paulo recorded 7.9—lower than many American cities. Santa Catarina: 10.1. Minas Gerais: 11.4. Distrito Federal: 11.2. The gap between Brazil’s safest and most dangerous states is sevenfold.
Why murder rates climbed for decades
The 1980s through early 2010s saw steady increases. Cities grew fast. Rural populations moved to urban areas. Peripheries filled with young men, poverty, few opportunities. Inequality deepened. Criminal groups moved in where government was weak. Guns flooded the market. Drug trafficking expanded and turned deadlier. Law enforcement couldn’t adapt fast enough.
Pernambuco and Rio de Janeiro both passed 50 per 100,000 by 2000. Espírito Santo hit 51 in 2010. Alagoas reached 66.88 that year—higher than most active war zones.
The turnaround
Mid-2010s brought a shift. National totals started dropping. São Paulo fell from 42.89 in 2000 to 7.9 in 2021. Rio de Janeiro went from 59.0 in 1980 to 27.2 in 2021. Distrito Federal dropped from 45.0 to 11.2.
What changed? Some states increased police budgets and launched targeted programs. Demographics shifted—fewer young people in violent age ranges. Gang conflicts cooled in places. Prison reforms cut riots that used to trigger street violence.
Other states went the opposite way. Bahia jumped from 6.0 in 1980 to 44.9 in 2021—a 648% increase. Amapá went from 4.0 to 53.8, over twelve times higher. Sergipe, Maranhão, Mato Grosso, Ceará, Amazonas—all tripled or worse.
Federative unit
1980 rate
1990 rate
2000 rate
2010 rate
2021 rate
% change (1980→2021)
Acre
17.0
15.7
19.56
22.49
21.2
+24.7%
Alagoas
15.0
29.2
26.55
66.88
31.8
+112.0%
Amapá
4.0
14.2
34.00
38.83
53.8
+1245.0%
Amazonas
11.0
16.5
20.90
31.06
39.1
+255.5%
Bahia
6.0
9.4
9.46
41.69
44.9
+648.3%
Ceará
10.0
8.8
17.19
31.80
37.0
+270.0%
Distrito Federal
45.0
23.7
34.07
30.58
11.2
-75.1%
Espírito Santo
29.0
34.0
48.14
50.98
28.2
-2.8%
Goiás
34.0
20.6
21.90
32.96
26.1
-23.2%
Maranhão
7.0
8.4
6.42
23.10
28.3
+304.3%
Mato Grosso
3.0
25.5
40.92
32.03
24.9
+730.0%
Mato Grosso do Sul
42.0
21.6
31.64
26.79
20.7
-50.7%
Minas Gerais
21.0
7.8
12.06
18.60
11.4
-45.7%
Pará
14.0
15.6
13.42
46.44
32.8
+134.3%
Paraíba
12.0
14.4
14.92
38.63
28.6
+138.3%
Paraná
26.0
13.3
18.85
34.33
20.8
-20.0%
Pernambuco
33.0
36.4
56.17
39.48
34.8
+5.5%
Piauí
7.0
5.9
8.35
13.18
23.8
+240.0%
Rio de Janeiro
59.0
34.0
52.75
35.44
27.2
-53.9%
Rio Grande do Norte
10.0
10.0
9.57
25.57
32.4
+224.0%
Rio Grande do Sul
25.0
17.5
16.55
19.50
15.9
-36.4%
Rondônia
38.0
49.6
35.37
34.95
25.0
-34.2%
Roraima
14.0
58.3
47.59
26.86
35.5
+153.6%
Santa Catarina
18.0
8.0
8.38
13.17
10.1
-43.9%
Sergipe
7.0
10.1
23.55
32.69
33.9
+384.3%
São Paulo
22.0
30.7
42.89
14.64
7.9
-64.1%
Tocantins
N/A
7.2
15.15
23.64
24.3
N/A
What comes next?
The recent drop from peak levels is real. São Paulo cut its rate by 64% since 1980. Rio de Janeiro dropped 54%. Distrito Federal fell 75%. Several southern states followed similar paths. But these gains aren’t locked in. Rates could reverse if circumstances change.
Progress can be fragile — the drop in overall homicides might not last if economic or criminal dynamics shift. Some states moved in the opposite direction — Bahia, Amapá, Sergipe and Maranhão saw large increases over the same years.
Whether the recent declines will hold depends on a few things: steady funding for police and prevention programs, investments that actually expand jobs and schooling, stronger controls on illegal firearms, and interventions that break criminal networks rather than simply shifting violence to a neighbor. São Paulo’s drop came from a particular mix of local politics, demographic shifts and greater policing capacity, so the same approach won’t necessarily work in places like Bahia or Amapá.