Housing Prices by State, 2000 vs 2026: Who Gained the Most Above Inflation?
Most Americans have watched housing prices climb over the past few decades. The geography of where homes cost the most has shifted pretty dramatically too.
Massachusetts topped the list in 2000. Homes there averaged $192,616. Hawaii was next at $191,347. California came in at $185,997. Scan through the data for all fifty states and you’ll notice something. None of them broke $200,000.
Twenty-five years pass and that’s completely changed. Just Mississippi and West Virginia have averages below $200,000 now. Everyone else crossed it.
Looking at raw numbers doesn’t tell you much by itself. A dollar bought more in 2000 than it does now. I adjusted all the old prices for inflation so we’re comparing actual purchasing power, not just watching digits get bigger.
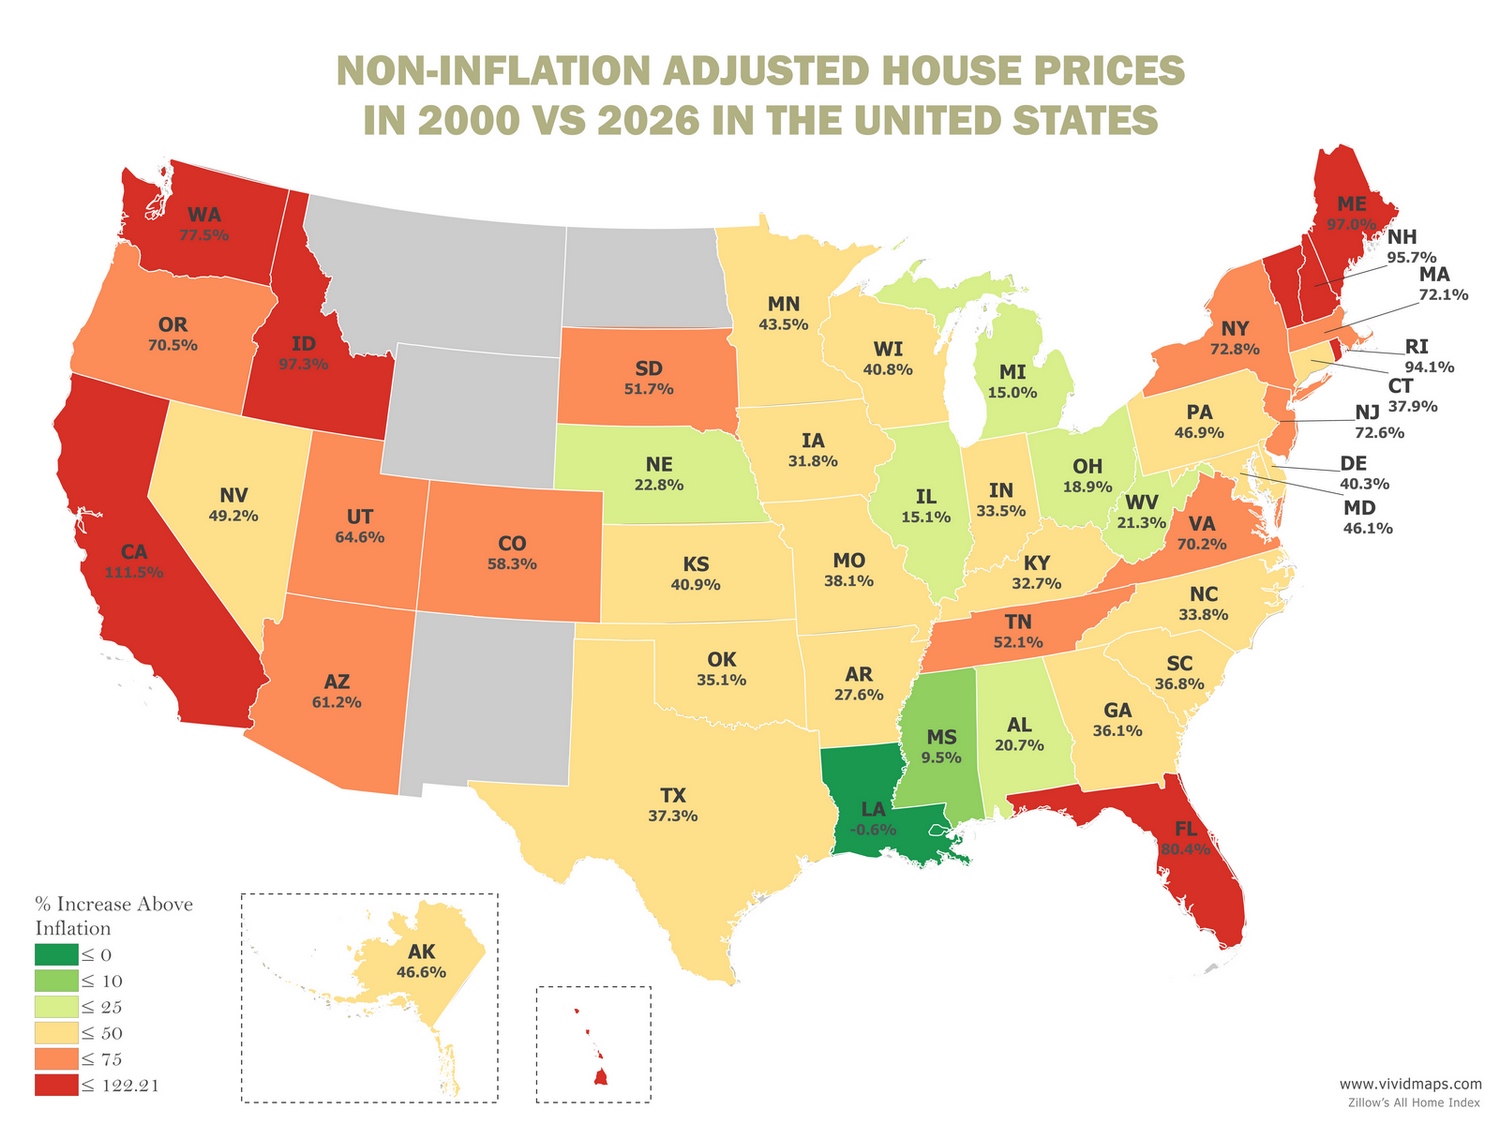
Look at Hawaii. Homes there averaged $191,347 in 2000. Fast forward to today and you’d expect them to cost around $367,386 just from inflation doing its normal thing. But they’re actually at $816,383. That’s 122% higher than inflation alone would explain. Homeowners gained almost $449,000 in real purchasing power per home.
California’s similar. Those $185,997 homes should be around $357,115 if they’d only matched inflation. They’re at $755,330 instead. Real gain of $398,216 per home, which is 111.5% above inflation.
The expensive northeastern states got even more expensive. Massachusetts hit $636,412, which is 72% beyond inflation. New York’s at $498,383 (up 72.76% in real terms). New Jersey reached $556,462, gaining 72.57%.
Idaho caught me off guard. It’s always been the affordable western state. Prices there jumped 97.3% above inflation. A $122,253 house in 2000 costs $463,123 now. Maine climbed 97%. New Hampshire went up 95.67%. These places don’t have the same geographic constraints as coastal markets, but they still saw massive appreciation.
| State | 2000 Home Prices | 2000 Inflation Adjusted | 2026 Home Prices | % Increase Above Inflation | $ Difference Above Inflation |
|---|---|---|---|---|---|
| Massachusetts | $192,616 | $369,823 | $636,412 | 72.09% | $266,589 |
| Hawaii | $191,347 | $367,386 | $816,383 | 122.21% | $448,997 |
| California | $185,997 | $357,115 | $755,330 | 111.51% | $398,216 |
| Colorado | $174,330 | $334,714 | $529,754 | 58.27% | $195,040 |
| Washington | $171,787 | $329,832 | $585,576 | 77.54% | $255,744 |
| New Jersey | $167,942 | $322,448 | $556,462 | 72.57% | $234,013 |
| Utah | $167,066 | $320,767 | $528,078 | 64.63% | $207,311 |
| Connecticut | $159,608 | $306,447 | $422,555 | 37.89% | $116,108 |
| District of Columbia | $159,126 | $305,523 | $572,181 | 87.28% | $266,658 |
| Nevada | $153,599 | $294,910 | $440,084 | 49.23% | $145,174 |
| New York | $150,248 | $288,476 | $498,383 | 72.76% | $209,907 |
| Maryland | $150,007 | $288,013 | $420,793 | 46.10% | $132,780 |
| Oregon | $149,058 | $286,191 | $487,843 | 70.46% | $201,652 |
| Delaware | $146,266 | $280,831 | $394,014 | 40.30% | $113,183 |
| Arizona | $134,747 | $258,714 | $417,121 | 61.23% | $158,407 |
| Alaska | $134,062 | $257,399 | $377,398 | 46.62% | $119,998 |
| New Hampshire | $130,549 | $250,654 | $490,462 | 95.67% | $239,808 |
| Rhode Island | $130,223 | $250,028 | $485,345 | 94.12% | $235,317 |
| North Carolina | $127,522 | $244,843 | $327,663 | 33.83% | $82,819 |
| Illinois | $125,450 | $240,864 | $277,191 | 15.08% | $36,326 |
| Georgia | $124,735 | $239,490 | $325,887 | 36.07% | $86,396 |
| Virginia | $122,624 | $235,439 | $400,622 | 70.16% | $165,183 |
| Idaho | $122,253 | $234,725 | $463,123 | 97.30% | $228,398 |
| Minnesota | $121,911 | $234,069 | $335,820 | 43.47% | $101,751 |
| Wisconsin | $117,206 | $225,035 | $316,876 | 40.81% | $91,841 |
| Nebraska | $113,351 | $217,633 | $267,254 | 22.80% | $49,621 |
| Michigan | $113,163 | $217,273 | $249,916 | 15.02% | $32,644 |
| South Carolina | $113,101 | $217,154 | $296,981 | 36.76% | $79,827 |
| Vermont | $112,842 | $216,657 | $379,669 | 75.24% | $163,012 |
| Texas | $111,702 | $214,468 | $294,444 | 37.29% | $79,975 |
| Tennessee | $110,884 | $212,897 | $323,808 | 52.10% | $110,911 |
| Louisiana | $108,003 | $207,366 | $206,193 | -0.57% | -$1,172 |
| Florida | $106,805 | $205,065 | $369,996 | 80.43% | $164,931 |
| South Dakota | $105,757 | $203,053 | $308,011 | 51.69% | $104,958 |
| Maine | $104,677 | $200,980 | $395,931 | 97.00% | $194,951 |
| Ohio | $102,642 | $197,074 | $234,363 | 18.92% | $37,290 |
| Alabama | $98,982 | $190,046 | $229,368 | 20.69% | $39,322 |
| Pennsylvania | $97,577 | $187,347 | $275,155 | 46.87% | $87,808 |
| Indiana | $96,139 | $184,586 | $246,452 | 33.52% | $61,865 |
| Missouri | $95,775 | $183,888 | $254,019 | 38.14% | $70,130 |
| Iowa | $88,959 | $170,801 | $225,028 | 31.75% | $54,228 |
| Mississippi | $88,614 | $170,138 | $186,256 | 9.47% | $16,118 |
| Arkansas | $88,332 | $169,597 | $216,491 | 27.65% | $46,894 |
| Kentucky | $87,943 | $168,851 | $224,082 | 32.71% | $55,231 |
| Kansas | $87,360 | $167,731 | $236,285 | 40.87% | $68,554 |
| Oklahoma | $82,688 | $158,760 | $214,507 | 35.11% | $55,746 |
| West Virginia | $72,434 | $139,074 | $168,655 | 21.27% | $29,582 |
| Montana | No Data | No Data | $451,657 | No Data | No Data |
| Wyoming | No Data | No Data | $354,219 | No Data | No Data |
| New Mexico | No Data | No Data | $306,813 | No Data | No Data |
| North Dakota | No Data | No Data | $276,906 | No Data | No Data |
The Mountain West shows a different pattern. Colorado’s combination of mountain communities and the Denver metro pushed state averages to $529,754, up 58.27% in real terms. Utah gained 64.63% above inflation. Montana and Wyoming don’t have 2000 data available, but their 2026 averages sit well above $350,000.
The Midwest barely moved. Illinois went up 15.08% in real terms. Michigan gained 15.02%. Ohio rose 18.92%. Over a 25-year span, those are tiny increases. Maybe these states built enough housing to keep up with demand. Or maybe their economies struggled in ways that kept prices flat. Probably some combination of both.
Louisiana is the only state where prices actually fell compared to inflation. It dropped 0.57%. Those $108,003 homes from 2000 would be worth $207,366 if they’d tracked with inflation. They’re at $206,193 instead. Katrina hit in 2005 and the housing market there just never bounced back. Twenty years later and you can still see it in the data.
The South had moderate but steady gains. Florida went up 80.43% above inflation even with hurricane season every year. Texas rose 37.29%. Tennessee climbed 52.1%. All beat inflation but didn’t match what happened on the coasts.
Why did different regions end up so far apart? Geography plays a big role. You can’t build more beachfront no matter how much demand there is. Tech companies concentrated in certain metros and started paying people ridiculous salaries. Remote work changed everything in the 2020s. People could suddenly live anywhere and keep their high-paying jobs. Some moved to Idaho, others to Maine. Meanwhile certain cities had zoning rules that basically prevented new construction. Each state got its own mix of these pressures.
Someone who bought a Massachusetts home in 2000 gained $266,589 in real purchasing power without lifting a finger. Just owned the property. Someone in Mississippi gained $16,118. Someone in Louisiana lost money in real terms. Housing worked as a geographic lottery for building wealth.
Affordability in 2000 looked completely different. Mississippi averaged $88,614 for a home. West Virginia sat at $72,434. Families with median incomes could actually buy houses in these places. Today even the cheapest states have crossed $165,000, and that’s just the average.
Only two states still have averages under $200,000. Mississippi’s at $186,256. West Virginia’s at $168,655. Every other state needs six figures to hit the average price. A $200,000 house from 2000 should run about $384,000 now if it just kept pace with inflation. Most markets went way past that.
The Carolinas are worth mentioning because they managed to grow without going crazy. North Carolina went up 33.83% above inflation. Homes there average $327,663 now. South Carolina’s at $296,981 after a 36.76% real increase. Both attracted new residents but avoided the price explosions you see in other growing states.
The American housing market got completely reorganized over these 25 years. Broad affordability turned into regional stratification. States that already cost more in 2000 mostly pulled further ahead. Some cheap markets suddenly weren’t cheap anymore, pushing out people who’d lived there for generations.


")

