Everyone knows coastal housing is expensive and the Midwest is cheaper. But “expensive” and “cheaper” don’t really capture what’s happening when you look at the actual numbers across every US county.
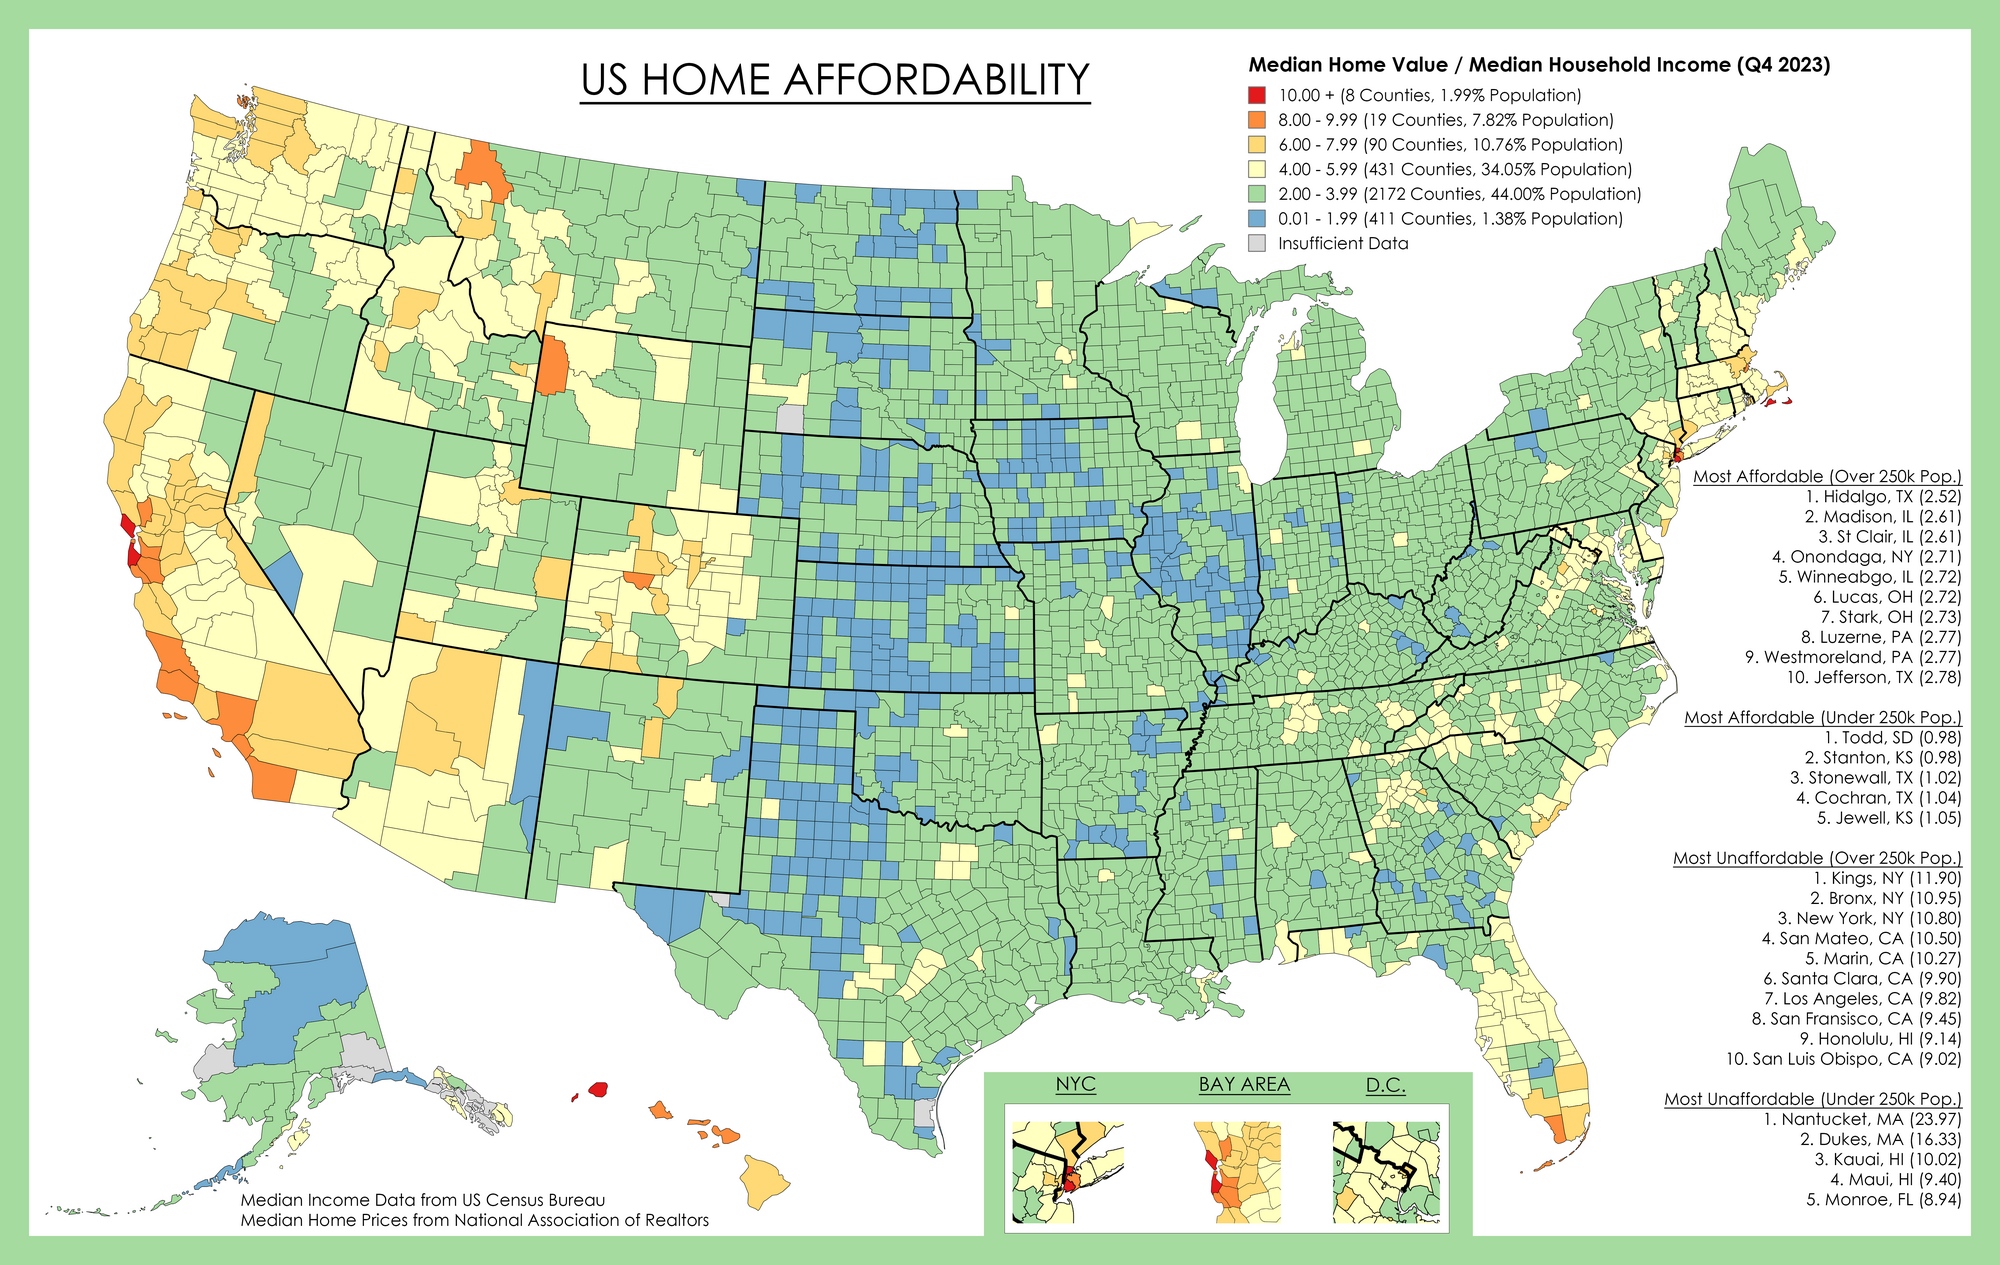
Reddit user TA-MajestyPalm compiled 2023 data from the US Census Bureau for median household incomes and pulled median home values from the National Association of Realtors, Zillow, and Redfin. The map shows how many years of median income it would take to buy the median home in each county.
Toledo, Ohio comes in at 2.8 times median income. San Jose hits 12 times. You could buy more than four Toledo homes for what one costs in San Jose relative to local earnings.
Housing experts generally say under 4x is manageable, 4x to 6x gets difficult, and above 6x pushes homeownership out of reach for typical earners. Though that doesn’t factor in property taxes, which can double your costs if you cross a township line, or down payments, or whatever assistance programs might exist locally.
Back in 2019, the national ratio sat at 4.1. Now it’s 5.0. Prices grew faster than incomes in almost every market during those five years.
Toledo, Akron, and McAllen are some of the few larger cities still below 3x. The Midwest and South generally keep lower ratios because there’s more land to build on and less competition for what’s there. But even places that used to be cheap have gotten less so.
San Jose and San Francisco both top 11x median income. Decades of tech wealth flowed into the Bay Area without anywhere close to enough new housing. Boston is at 6.5x. New York stays expensive partly because you run into water or existing development no matter which direction you try to expand.
Some cities were expected to offer more affordable options, but that changed quickly. In Boise, for example, prices rose by 67% between 2019 and 2022. Austin went up 66%, Phoenix 65%. Median incomes in those same cities? Maybe 7-15% growth. Remote work let people move there faster than anyone could build apartments or subdivisions. Miami reached 8.7x by 2024, which is funny considering how many people relocated there specifically because it was supposed to be cheaper than where they came from.
Remote workers moved in faster than builders could respond
Sun Belt
Miami, Phoenix, Austin
6-8.7x
Population boom plus speculation
Midwest/South
Toledo, Akron, McAllen
2.8-3.5x
Less competition, more space
Why such huge differences? A lot of it comes down to whether new housing can actually get built. Zoning laws restrict what’s allowed. Mountains and coastlines block expansion. Neighborhood groups often oppose new apartment buildings. When 100 families want homes but only 70 are available, prices go up until 30 families can no longer afford them. Strong job markets also attract more people to certain cities, which adds pressure that wages do not always match.
The Million-Dollar Normal
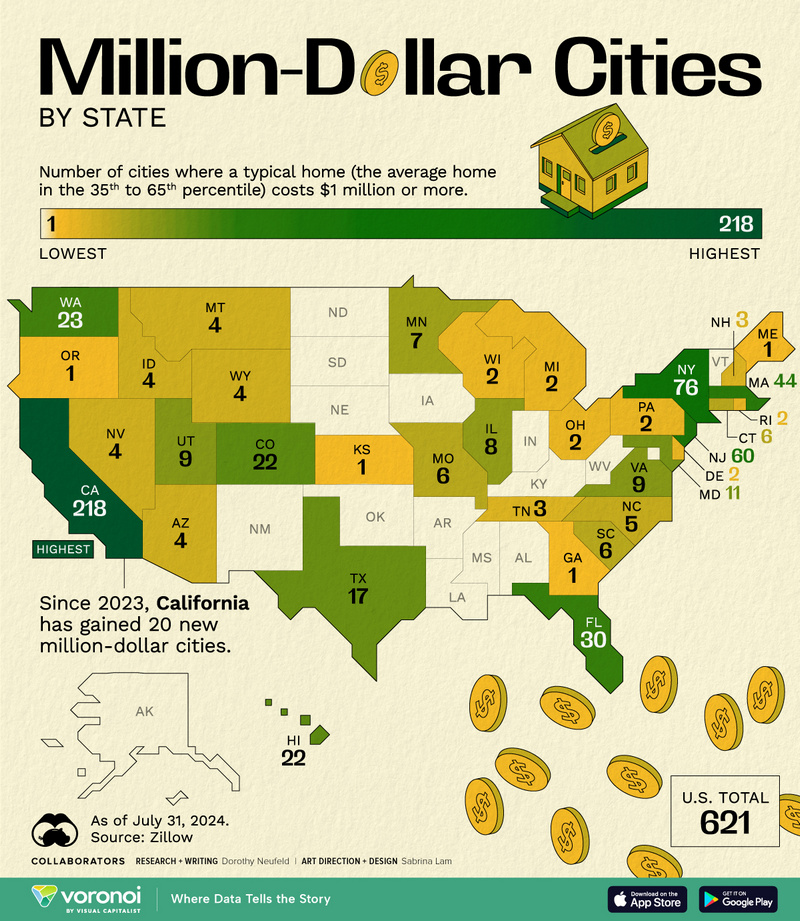
While most of America deals with basic affordability questions, some cities have crossed into entirely different territory. Zillow’s data (compiled by Visual Capitalist) shows 621 US cities where the median home now sells for over $1 million as of July 2024. Not luxury homes—regular ones in the middle of the market.
California has 218 of those 621 cities. More than New York, New Jersey, Massachusetts, and Florida combined. In Atherton, a typical home goes for $7.5 million. California homebuyers pay around $6,000 per month for a mid-tier purchase once you count mortgage, insurance, and taxes. Just from February 2023 to July 2024, the state added 20 more cities to the million-dollar list!!!
Rank
State
Million-Dollar Cities
1
California
218
2
New York
76
3
New Jersey
60
4
Massachusetts
44
5
Florida
30
6
Washington
23
7
Colorado
22
7
Hawaii
22
9
Texas
17
10
Maryland
11
New York has 76 cities over the million-dollar threshold. Prices there went up 10.9% year-over-year in early 2023, one of the fastest jumps anywhere. New Jersey sits at 60 and saw big increases throughout 2023.
On the flip side, 15 states don’t have a single city where typical homes hit seven figures. Mostly Midwest and Southern states with lower costs overall but also fewer high-paying jobs and slower economic growth.
Where do all these million-dollar cities cluster? Places where tech and finance jobs concentrate. Places where you can’t build outward because of geography. Places where demand has outrun supply for so long that high prices became the baseline. California’s 218 cities came from tech industry wealth piling up while zoning boards blocked housing projects year after year.
The affordable options keep shrinking. In 2019, twenty large metropolitan areas had ratios under three times. By 2024, only three were left. Currently, 17 states have housing markets that economists classify as unaffordable. In early 2020, California was the only one. Most of that shift happened in 2022 and 2023 when the Fed raised interest rates.
This wasn’t something that happened suddenly. Zoning codes written decades ago still control what gets built today. Geographic barriers that have always existed matter more as cities fill in available space. Economic shifts pull people toward certain regions while others lose population. The patterns move slowly, but they do move.
I would like to see a map showing self-interest. Example…. Housing self-interest – If my housing was being paid for by taxpayers should I vote for a politician who would take away that money to provide me housing? How about food, phone, cable TV, Healthcare self interest… Should I vote for a politician who would take away the funding for those things for me? What if I was receiving those things funded by the taxpayers should I even be allowed TO vote? I would like to see a map of self-interest /dependency on government, …map.


I would like to see a map showing self-interest. Example…. Housing self-interest – If my housing was being paid for by taxpayers should I vote for a politician who would take away that money to provide me housing? How about food, phone, cable TV, Healthcare self interest… Should I vote for a politician who would take away the funding for those things for me? What if I was receiving those things funded by the taxpayers should I even be allowed TO vote? I would like to see a map of self-interest /dependency on government, …map.